In this tutorial, you will lesarn more about the Chart-me data exchange format (CMDXF). This format lets you input your own data in a specified format, so that the chart-me library can interpret the data and can work with it.
Data Format
The CMDXF data is a valid json data format. It has the following structure:
Data Example
In the quartals demo you can see a simple example of how the cmdxf looks like. You can download the quartals.json. For a better feeling, you can open the json files in a browser or in an developer IDE like Visual Studio, Eclipe or Aptana and so on.
Columns / Rows
The columns and rows structures defines the axis definitions.
- columns - x-axis
- rows - y-axis They are two-dimensional number arrays. The length of the arrays must correspond the number of columns or rows. The inner array must correspond the number of dimensions of the data. The numbers inside the inner array stands for the position of the corresponding member inside the dimension, where the first number stands for the first dimension, the second for the second dimension and so on. For example the following columns and rows describe the following selections of data for this set of dimensions:
- Quartals
- Q1
- Q2
- Q3
- Q4
- Scenarios
- AC
- PL
- Regions
- Berlin
- Munich
| Q1 | Q2 | Q3 | Q4 | |
|---|---|---|---|---|
| AC | AC | PL | PL | |
| Berlin | 100 | 120 | 90 | 110 |
| Munich | 90 | 110 | 120 | 110 |
...
columns: [[1, 0, -1]]
...
| Q1 | Q2 | Q3 | Q4 | |
|---|---|---|---|---|
| AC | AC | PL | PL | |
| Berlin | 100 | 120 | 90 | 110 |
| Munich | 90 | 110 | 120 | 110 |
...
rows: [[-1, -1, 0]]
...
| Q1 | Q2 | Q3 | Q4 | |
|---|---|---|---|---|
| AC | AC | PL | PL | |
| Berlin | 100 | 120 | 90 | 110 |
| Munich | 90 | 110 | 120 | 110 |
...
columns: [
	[0, 0, -1],
	[1, 0, -1],
	[2, 1, -1],
	[3, 1, -1],
],
rows: [
	[-1, -1, 0],
	[-1, -1, 1]
]
...
Visualization (optional)
It is possible to define how your data looks like. Therefore you can set the visualization information in the CMDXF data optionally. The visualization information can be one of the following:
| Attribute | Description | Localizations | Template |
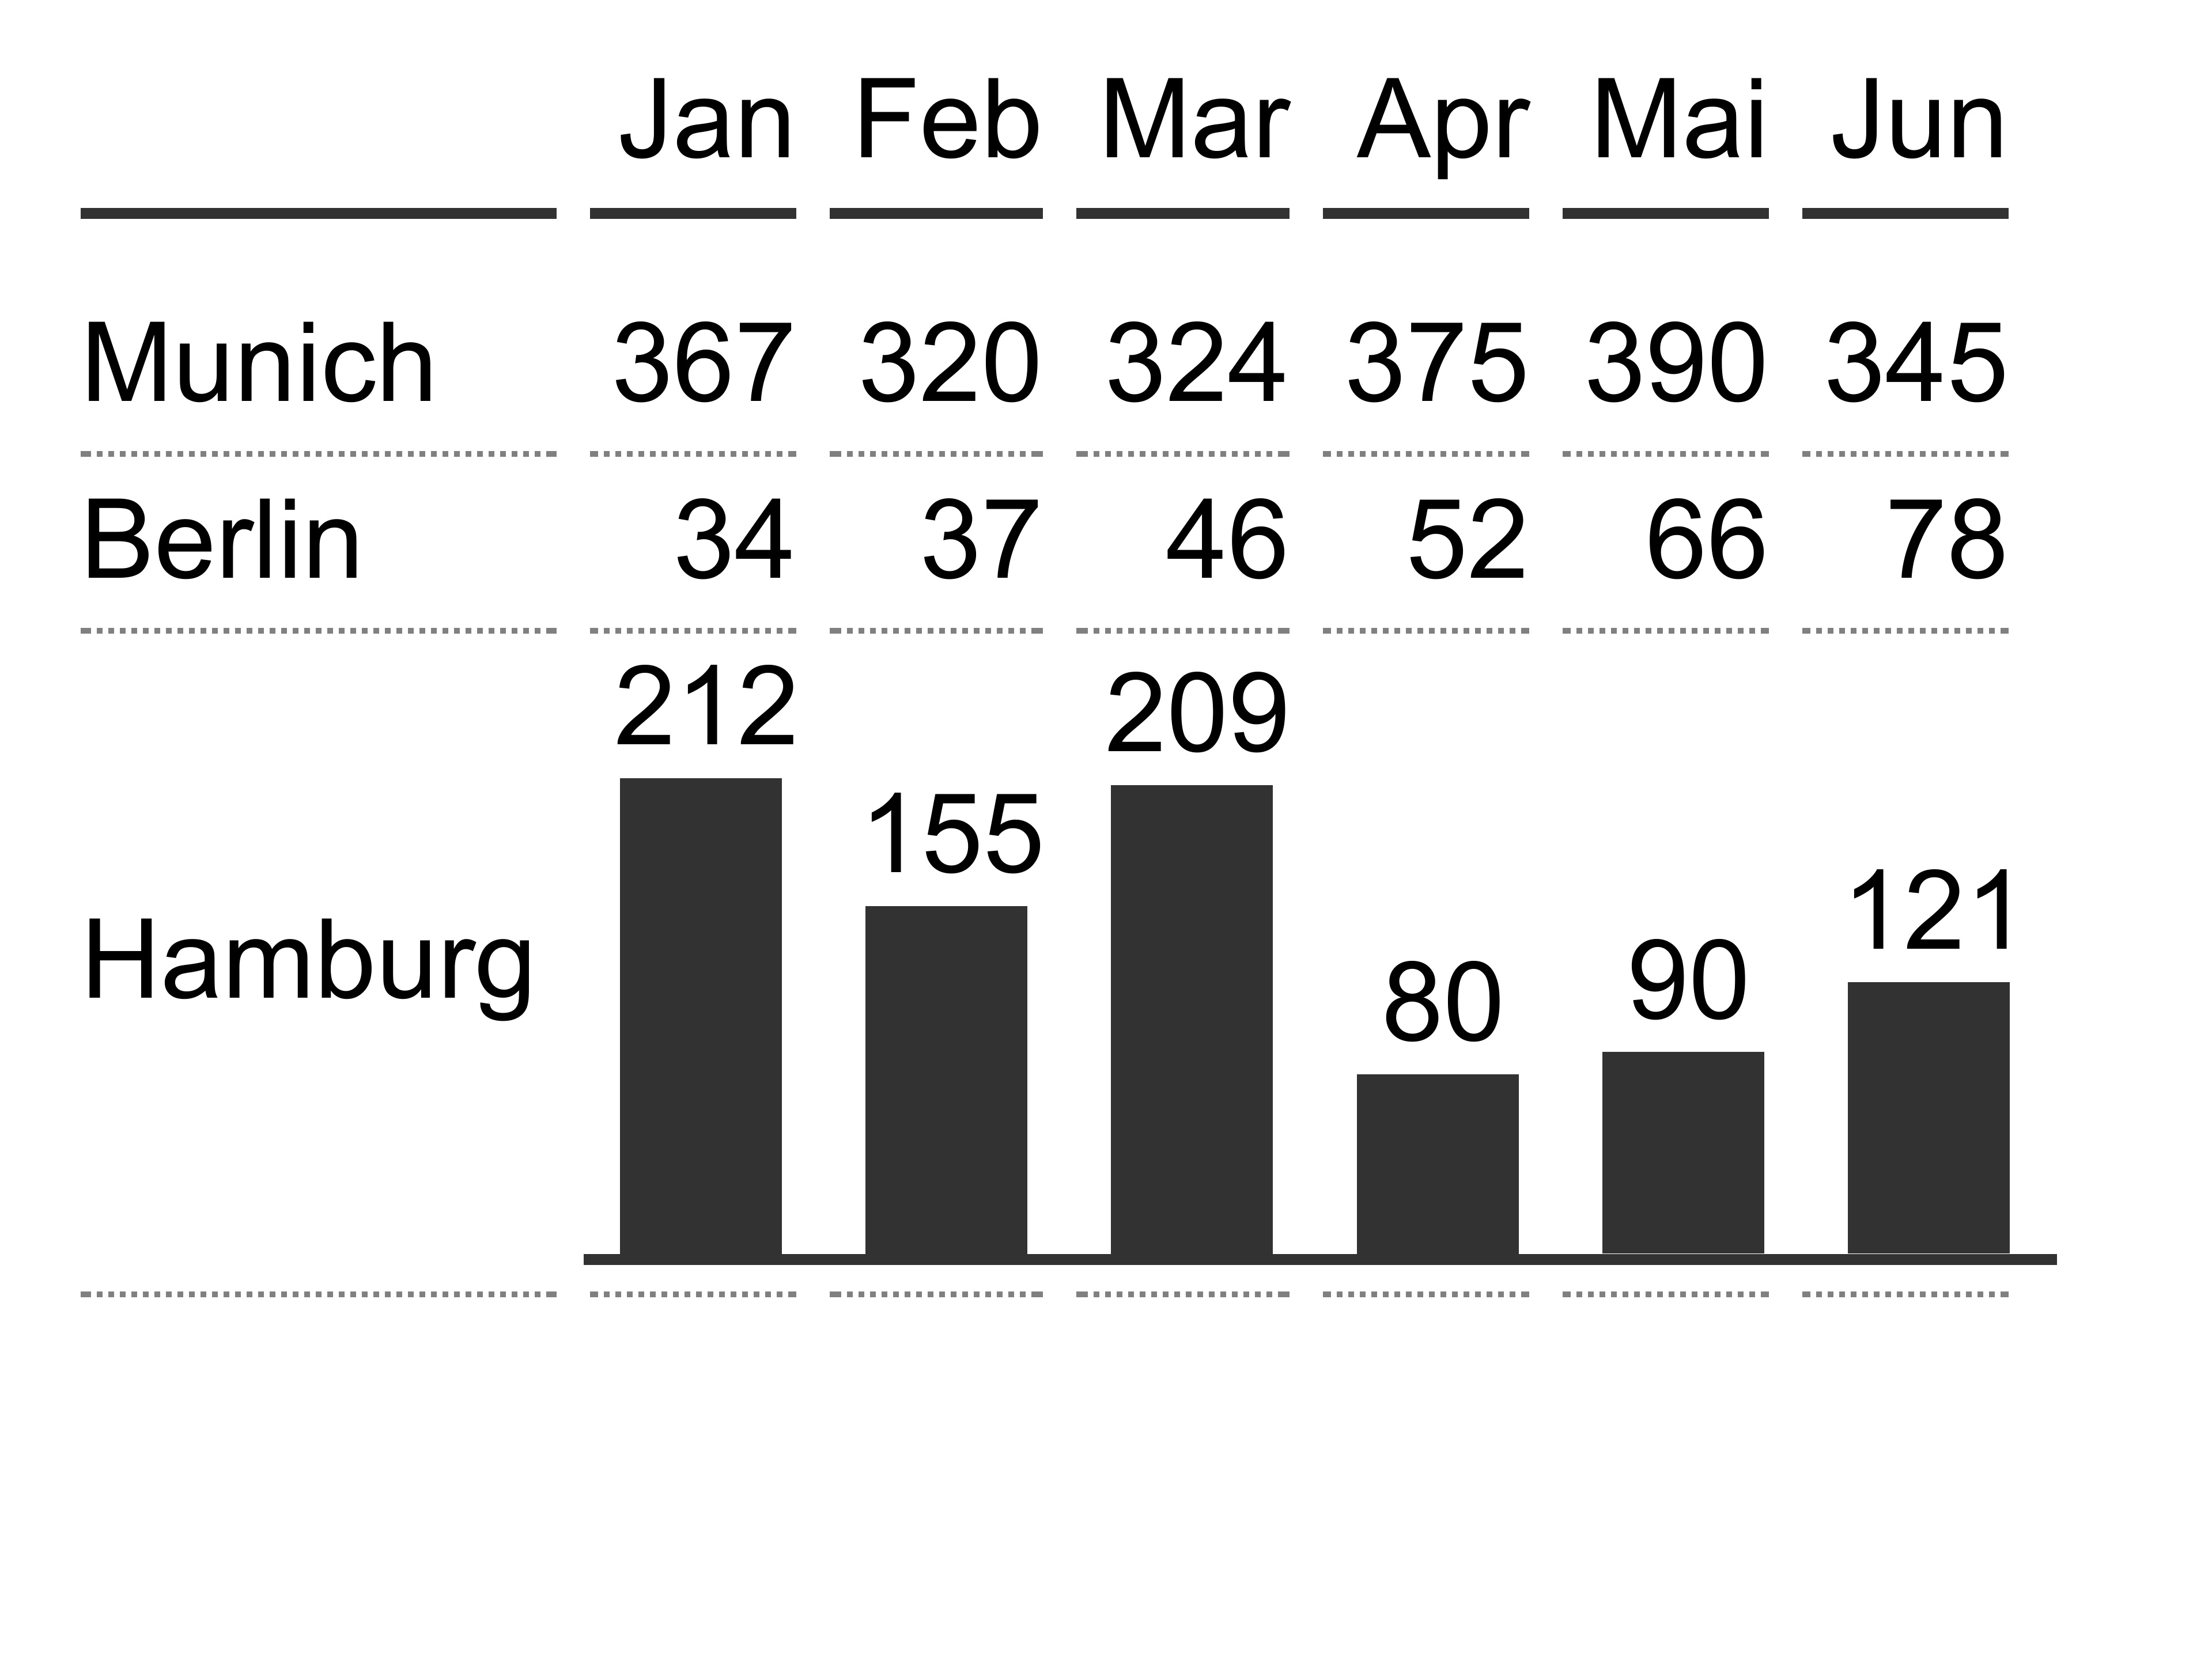
| TABLE_TIME | Visualize the CMDXF data as a table in a timeline form. If the CMDXF data includes a hierarchy in the row dimensions, the table will be shown in a hierarchical view. Each column will become a new table column. |
Subcharts: Data rows Categroies: Data columns Variances: Data rows |
 |
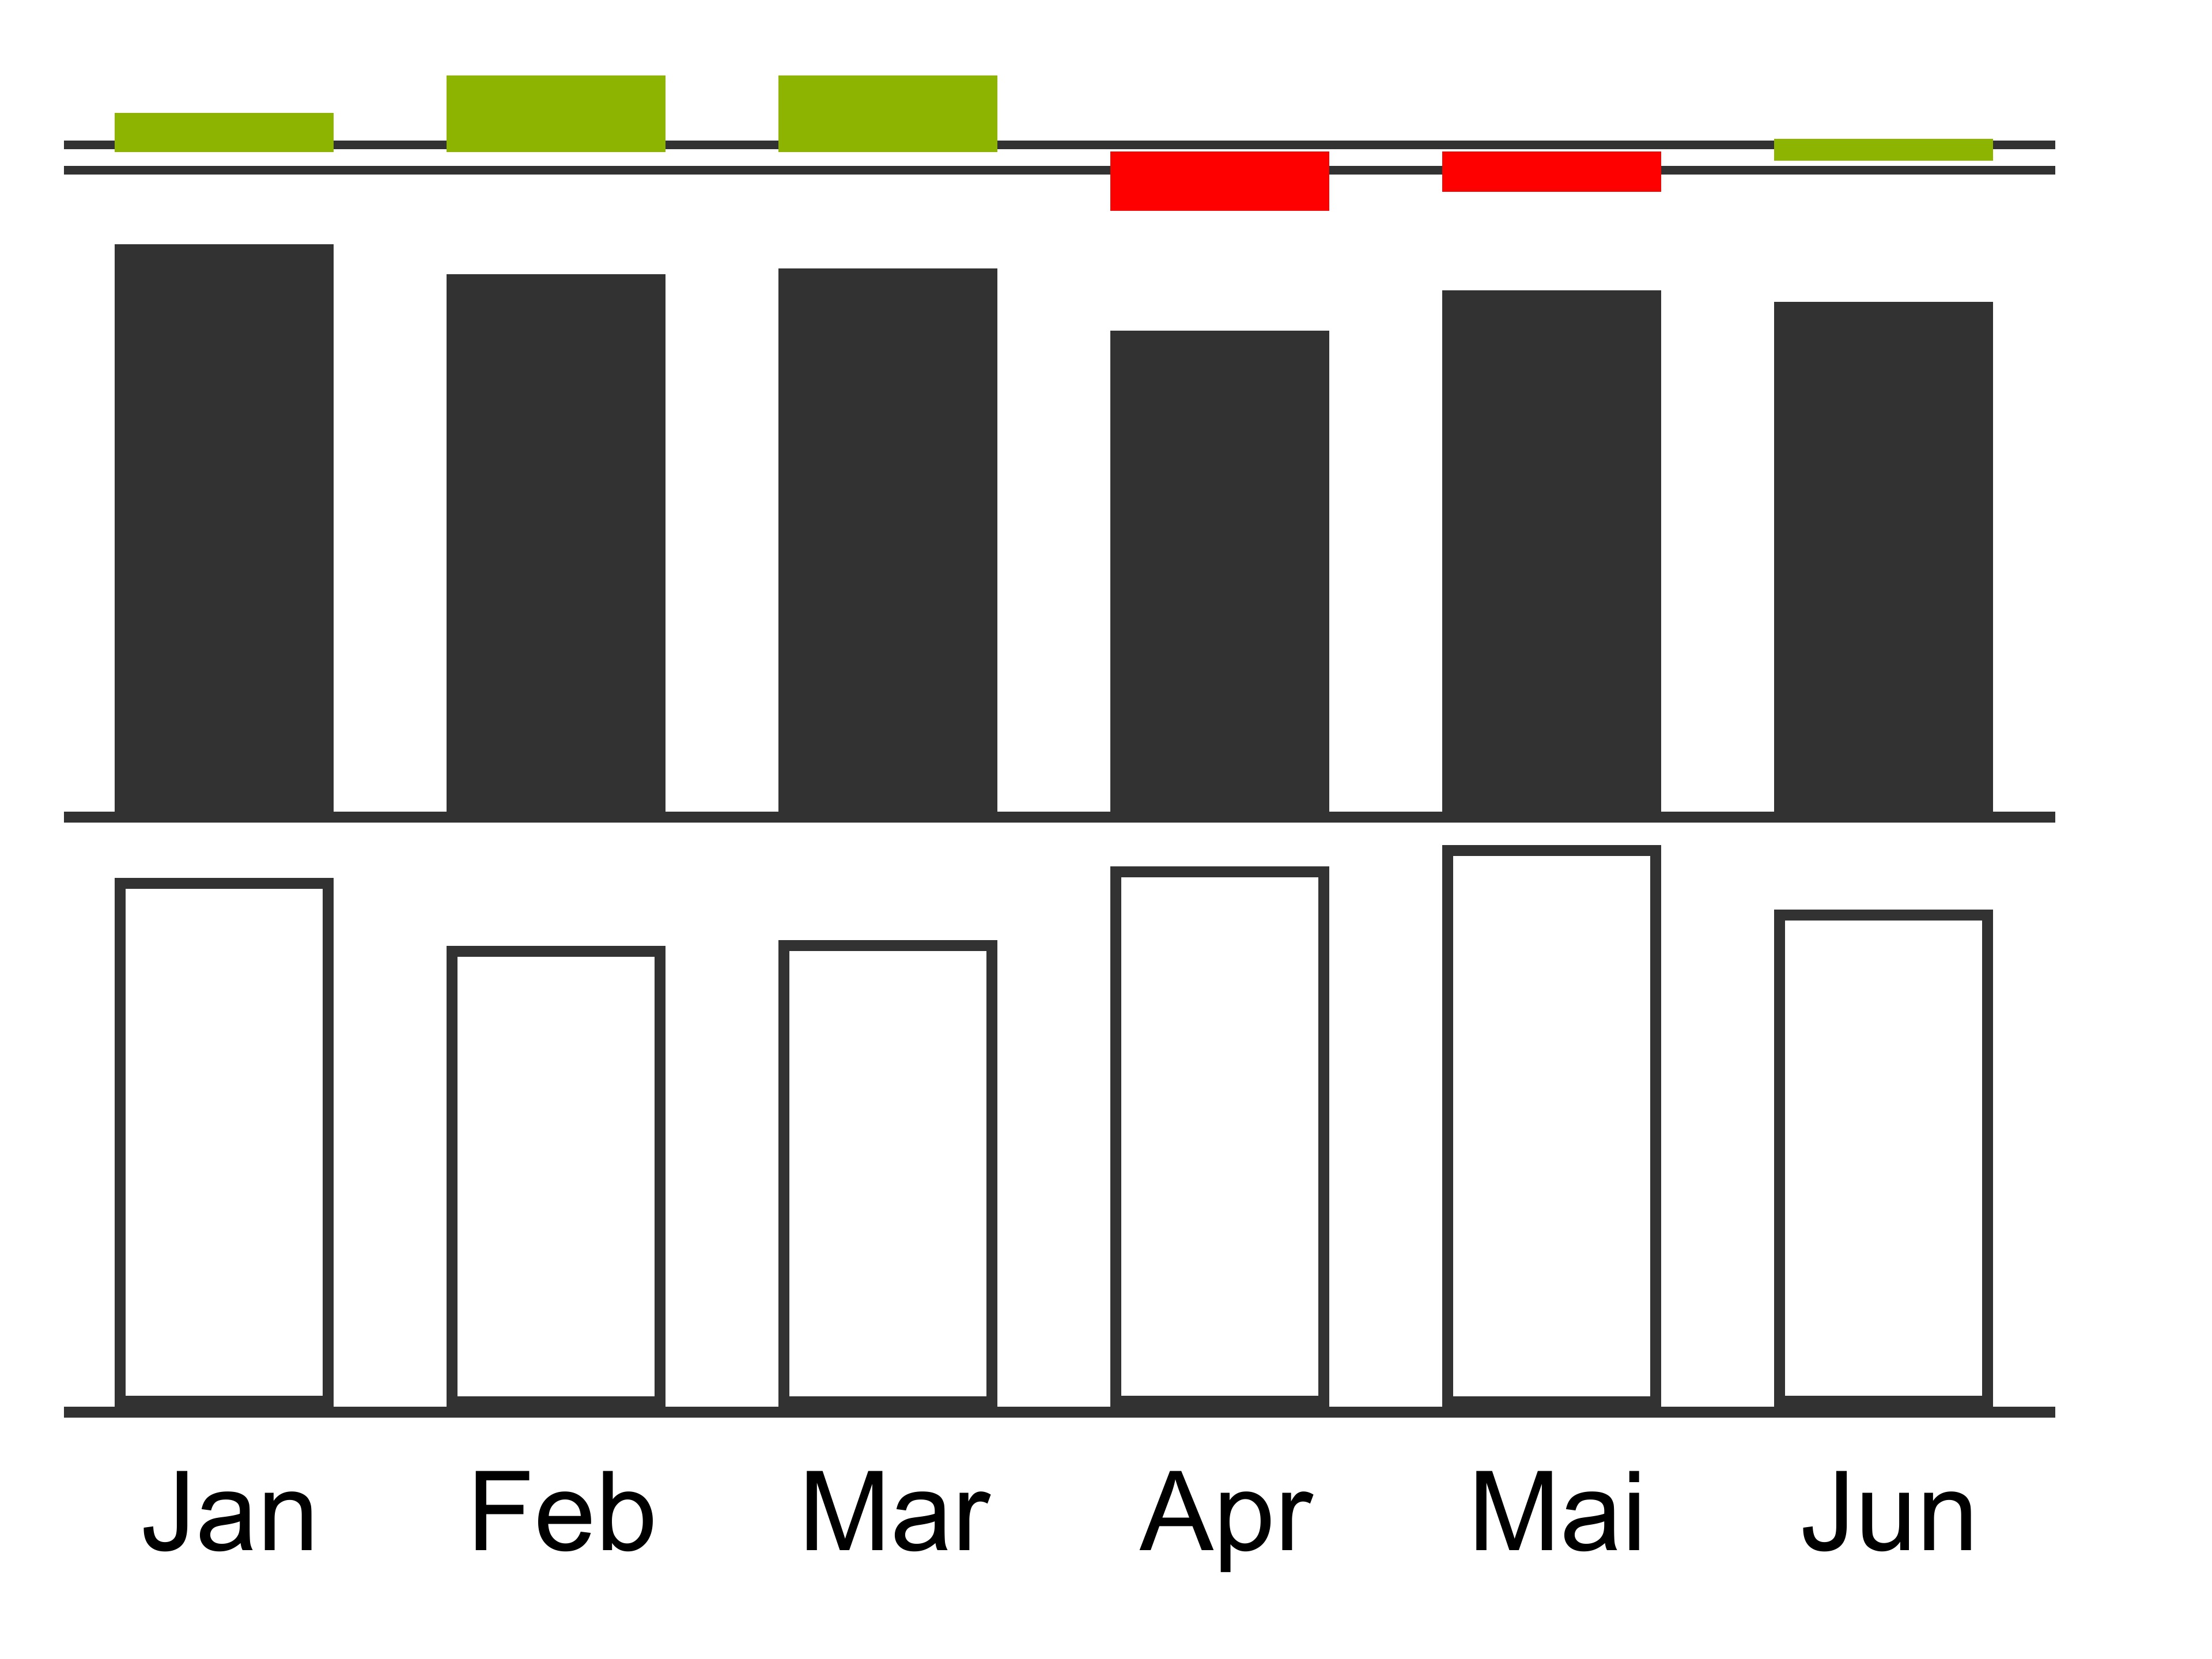
| SINGLE_TIME | The CMDXF data will be shown as bars in a timeline. Each row will have its own axis. |
Subcharts: Data rows Categroies: Data columns Variances: Data rows |
 |
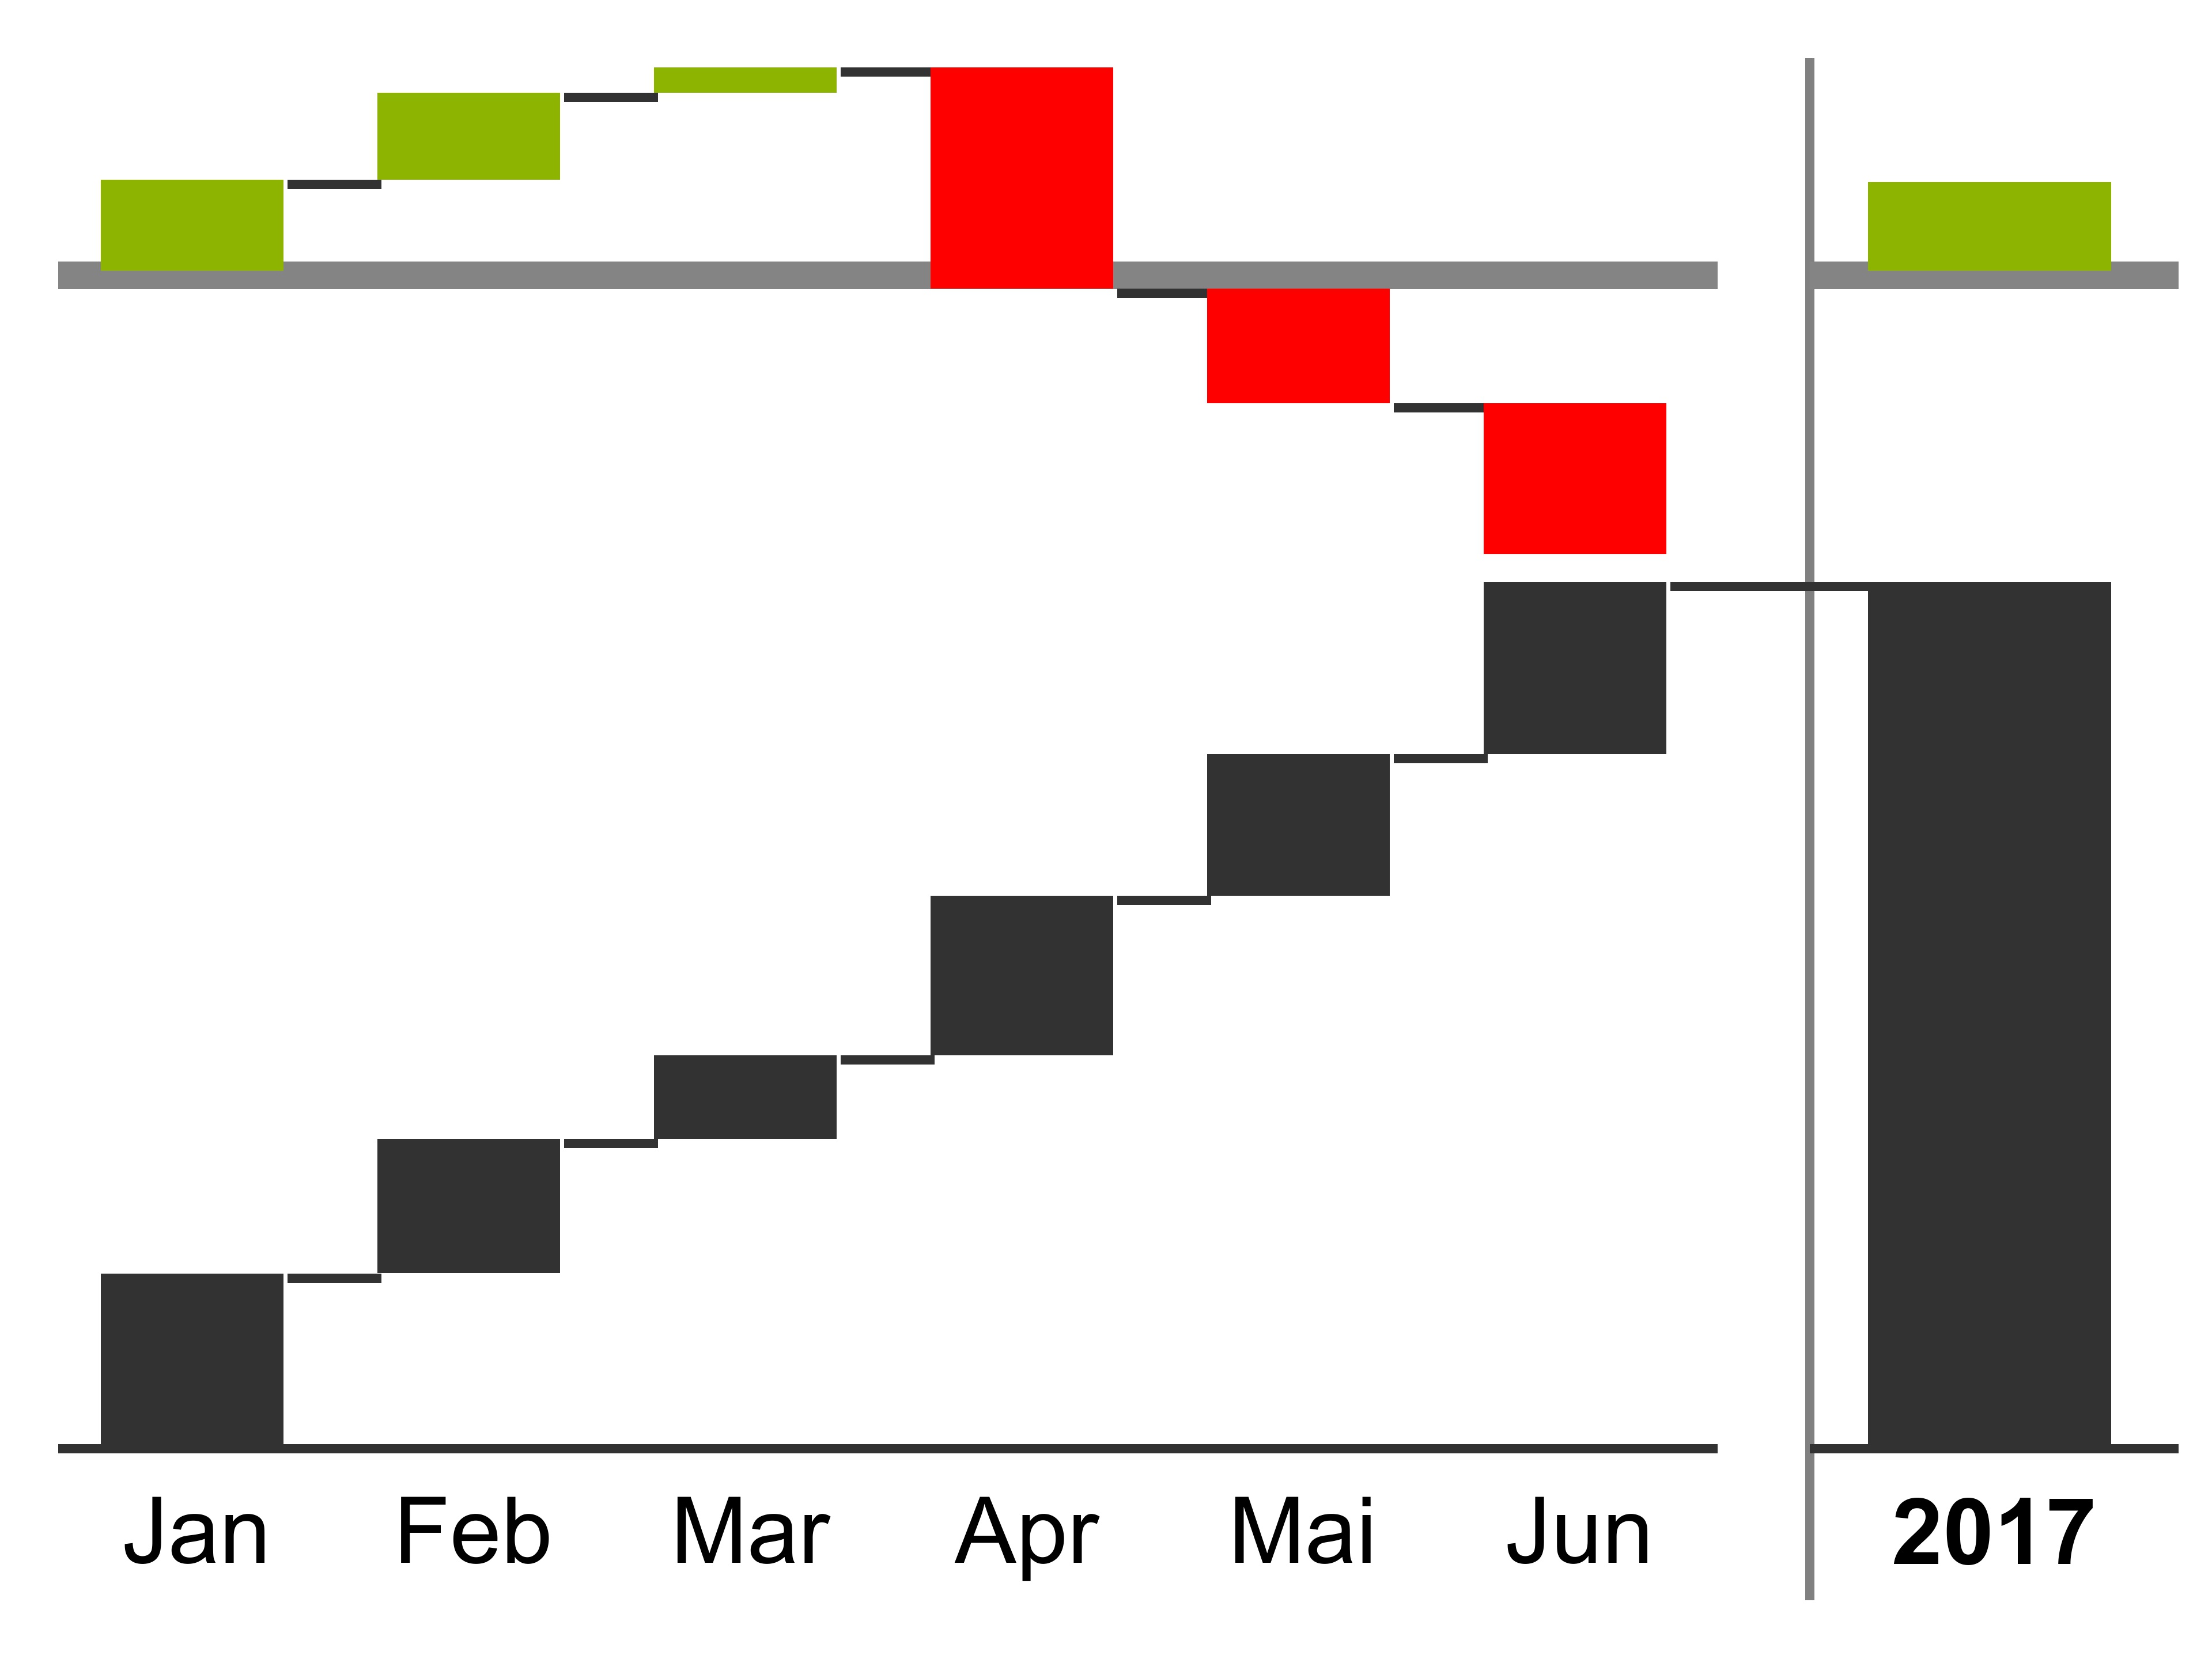
| WATERFALL_TIME | The CMDXF data will be shown as waterfall bars in a timeline. Each row will have its own axis. The waterfall depends on the hierarchy informations of the row dimensions. |
Subcharts: Data rows Categroies: Data columns Variances: Data rows |
 |
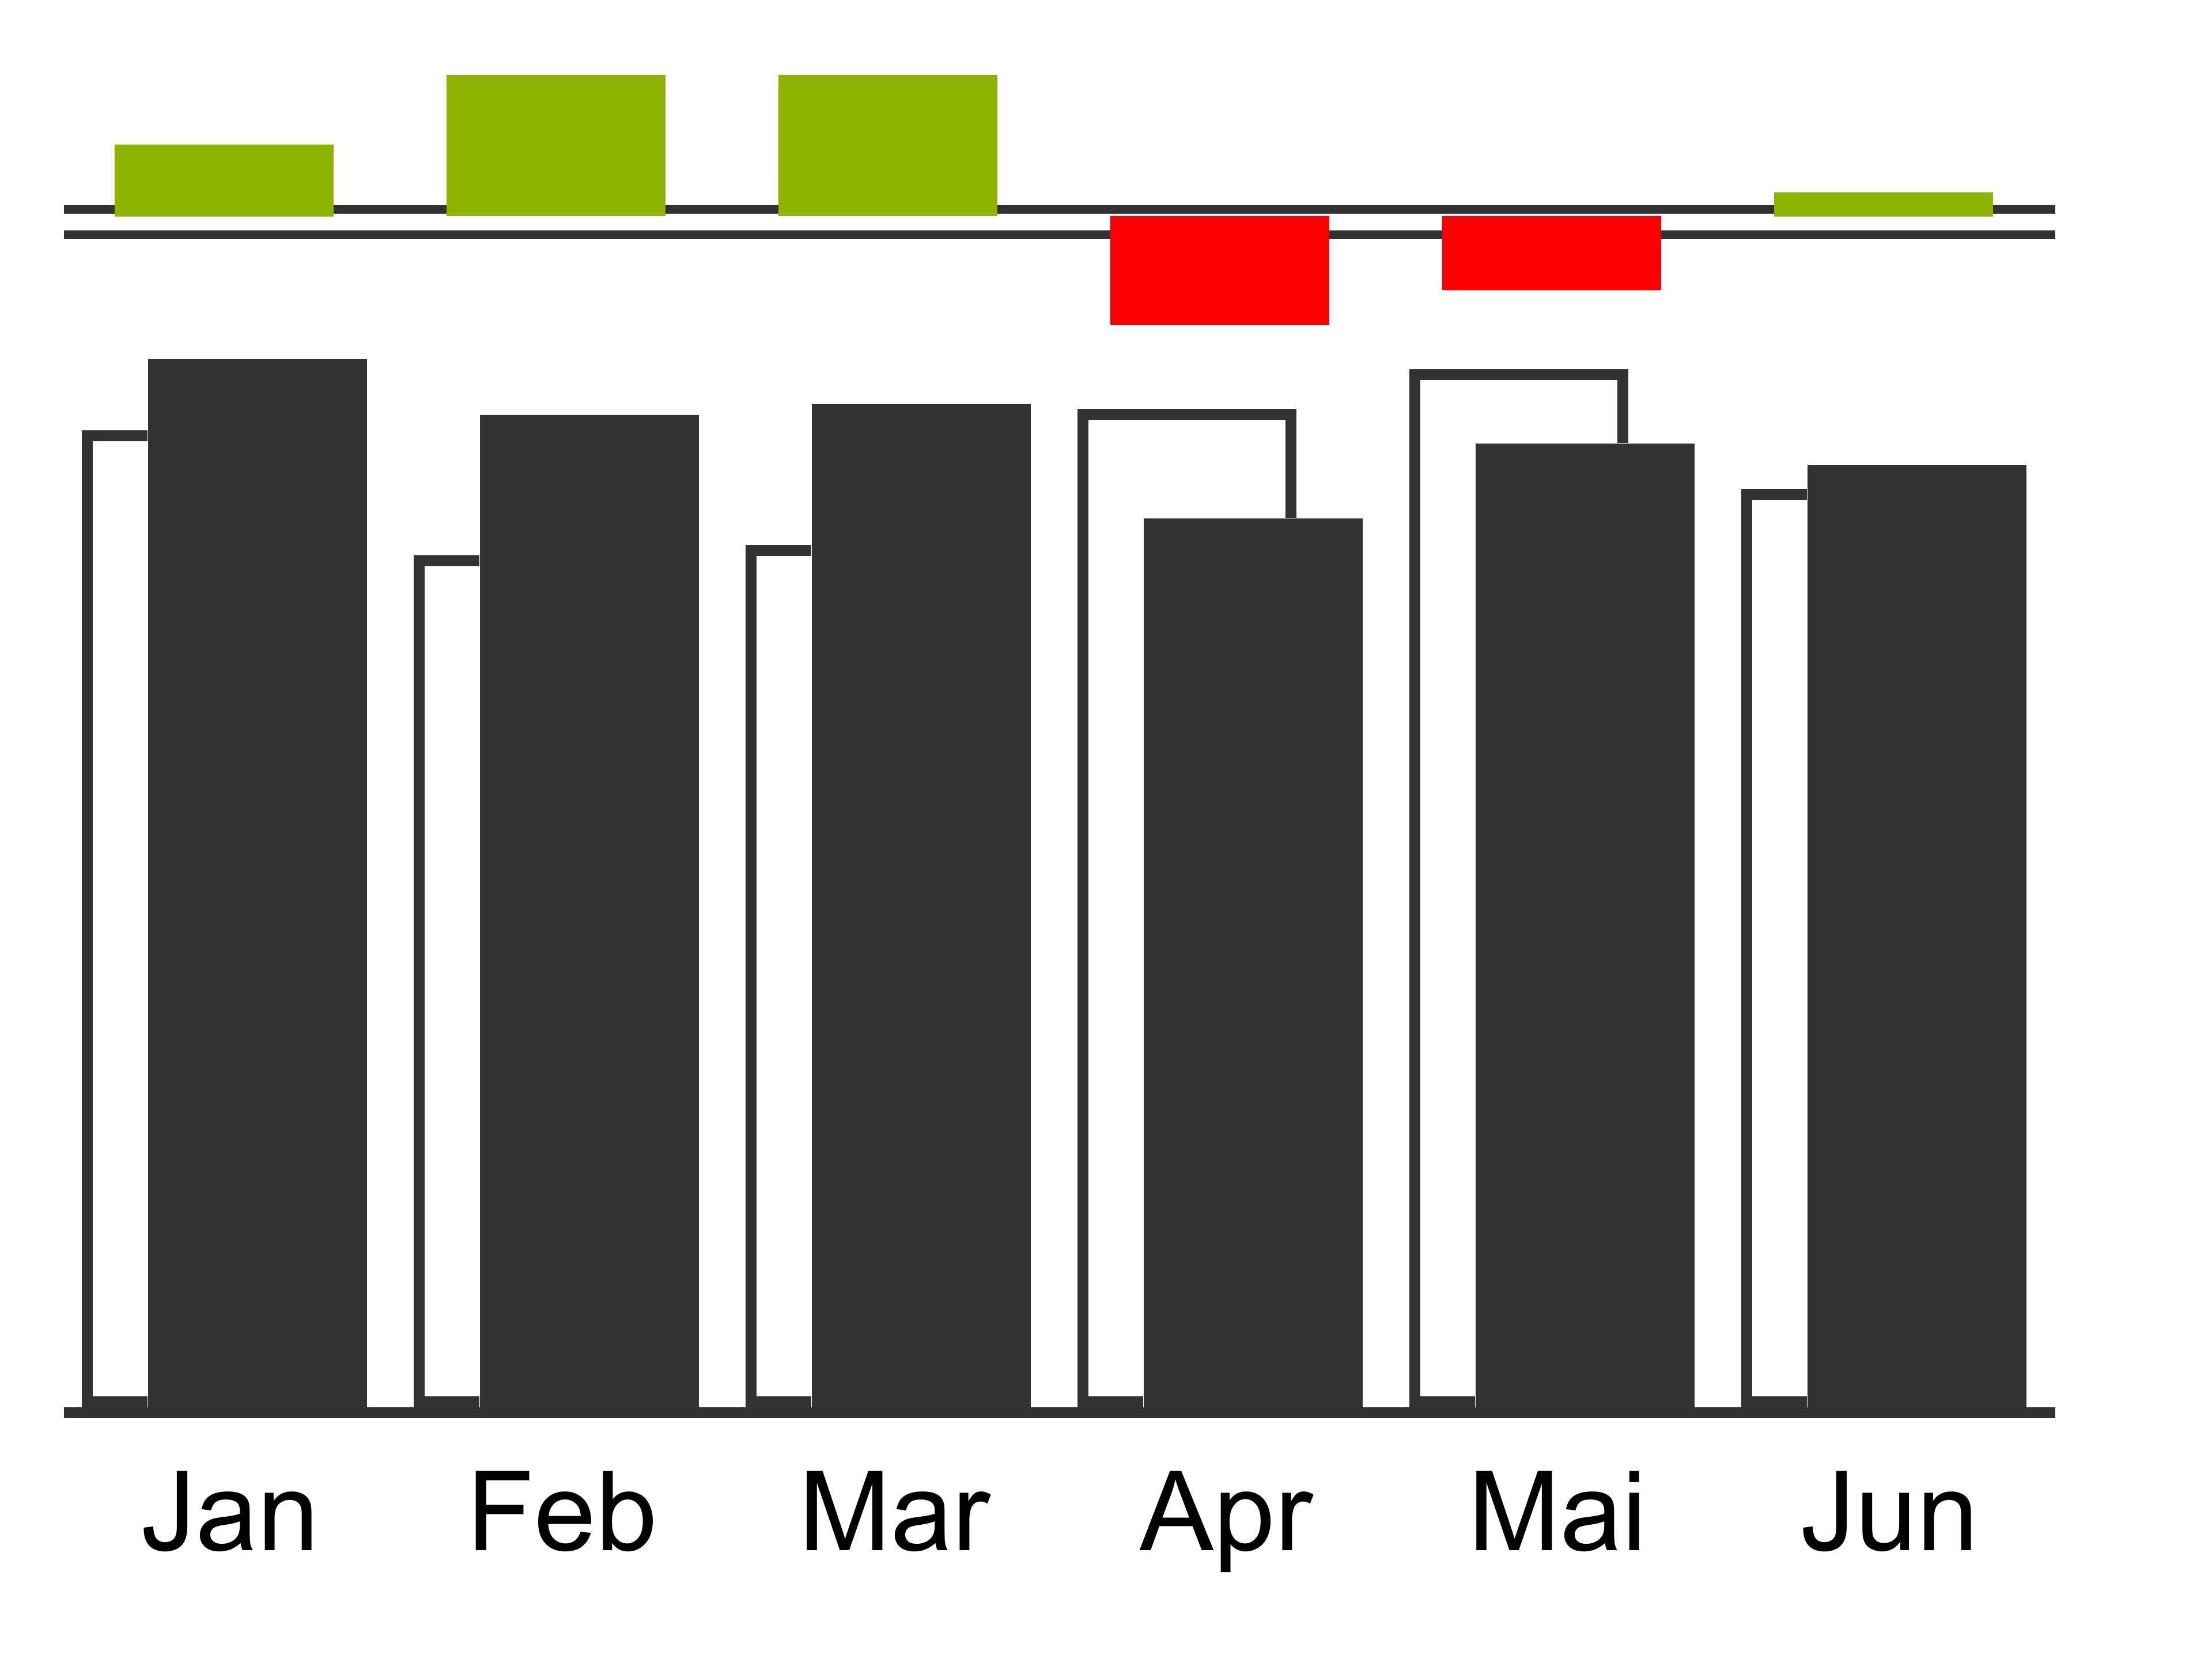
| GROUPED_TIME | The CMDXF data will be shown as grouped bars in a timeline. Each row will be shown as a new series in one axis for the whole visualization. |
Subcharts: Data rows Categroies: Data columns Variances: Data rows |
 |
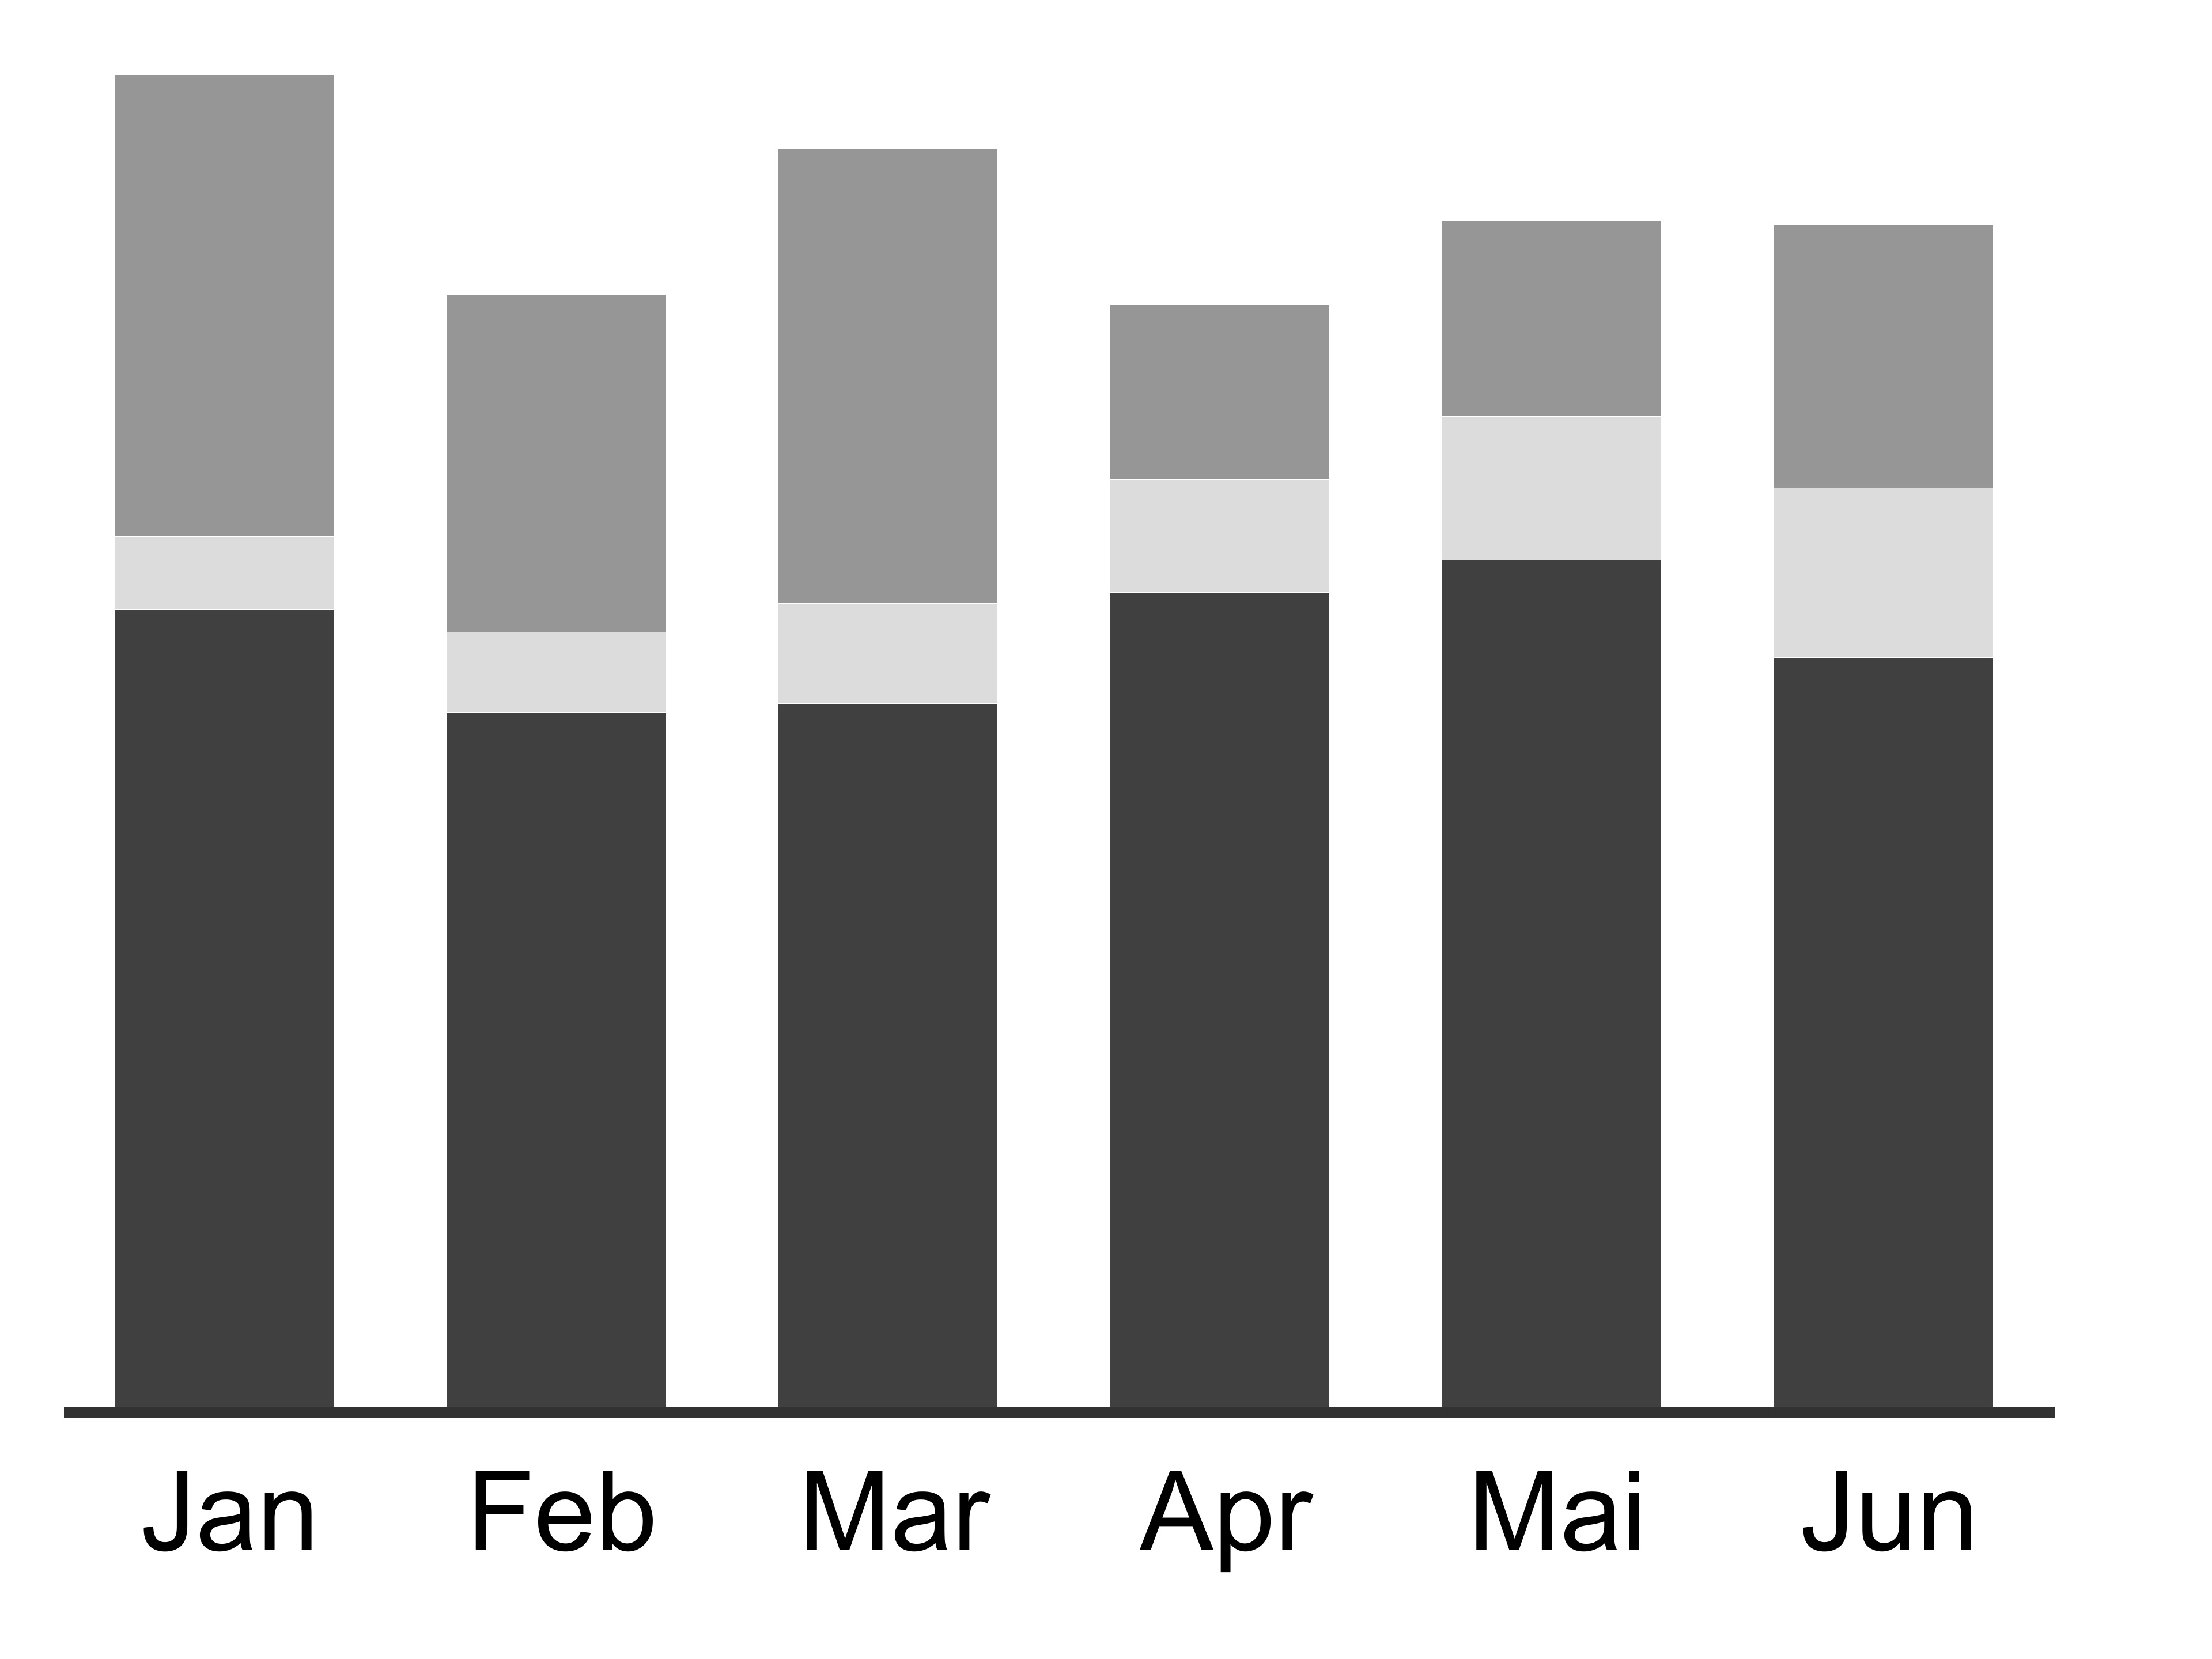
| STACKED_TIME | The CMDXF data will be shown as stacked bars in a timeline. Each row will be shown as a new stacked series in one axis for the whole visualization. |
Subcharts: Data rows Categroies: Data columns Variances: Data rows |
 |
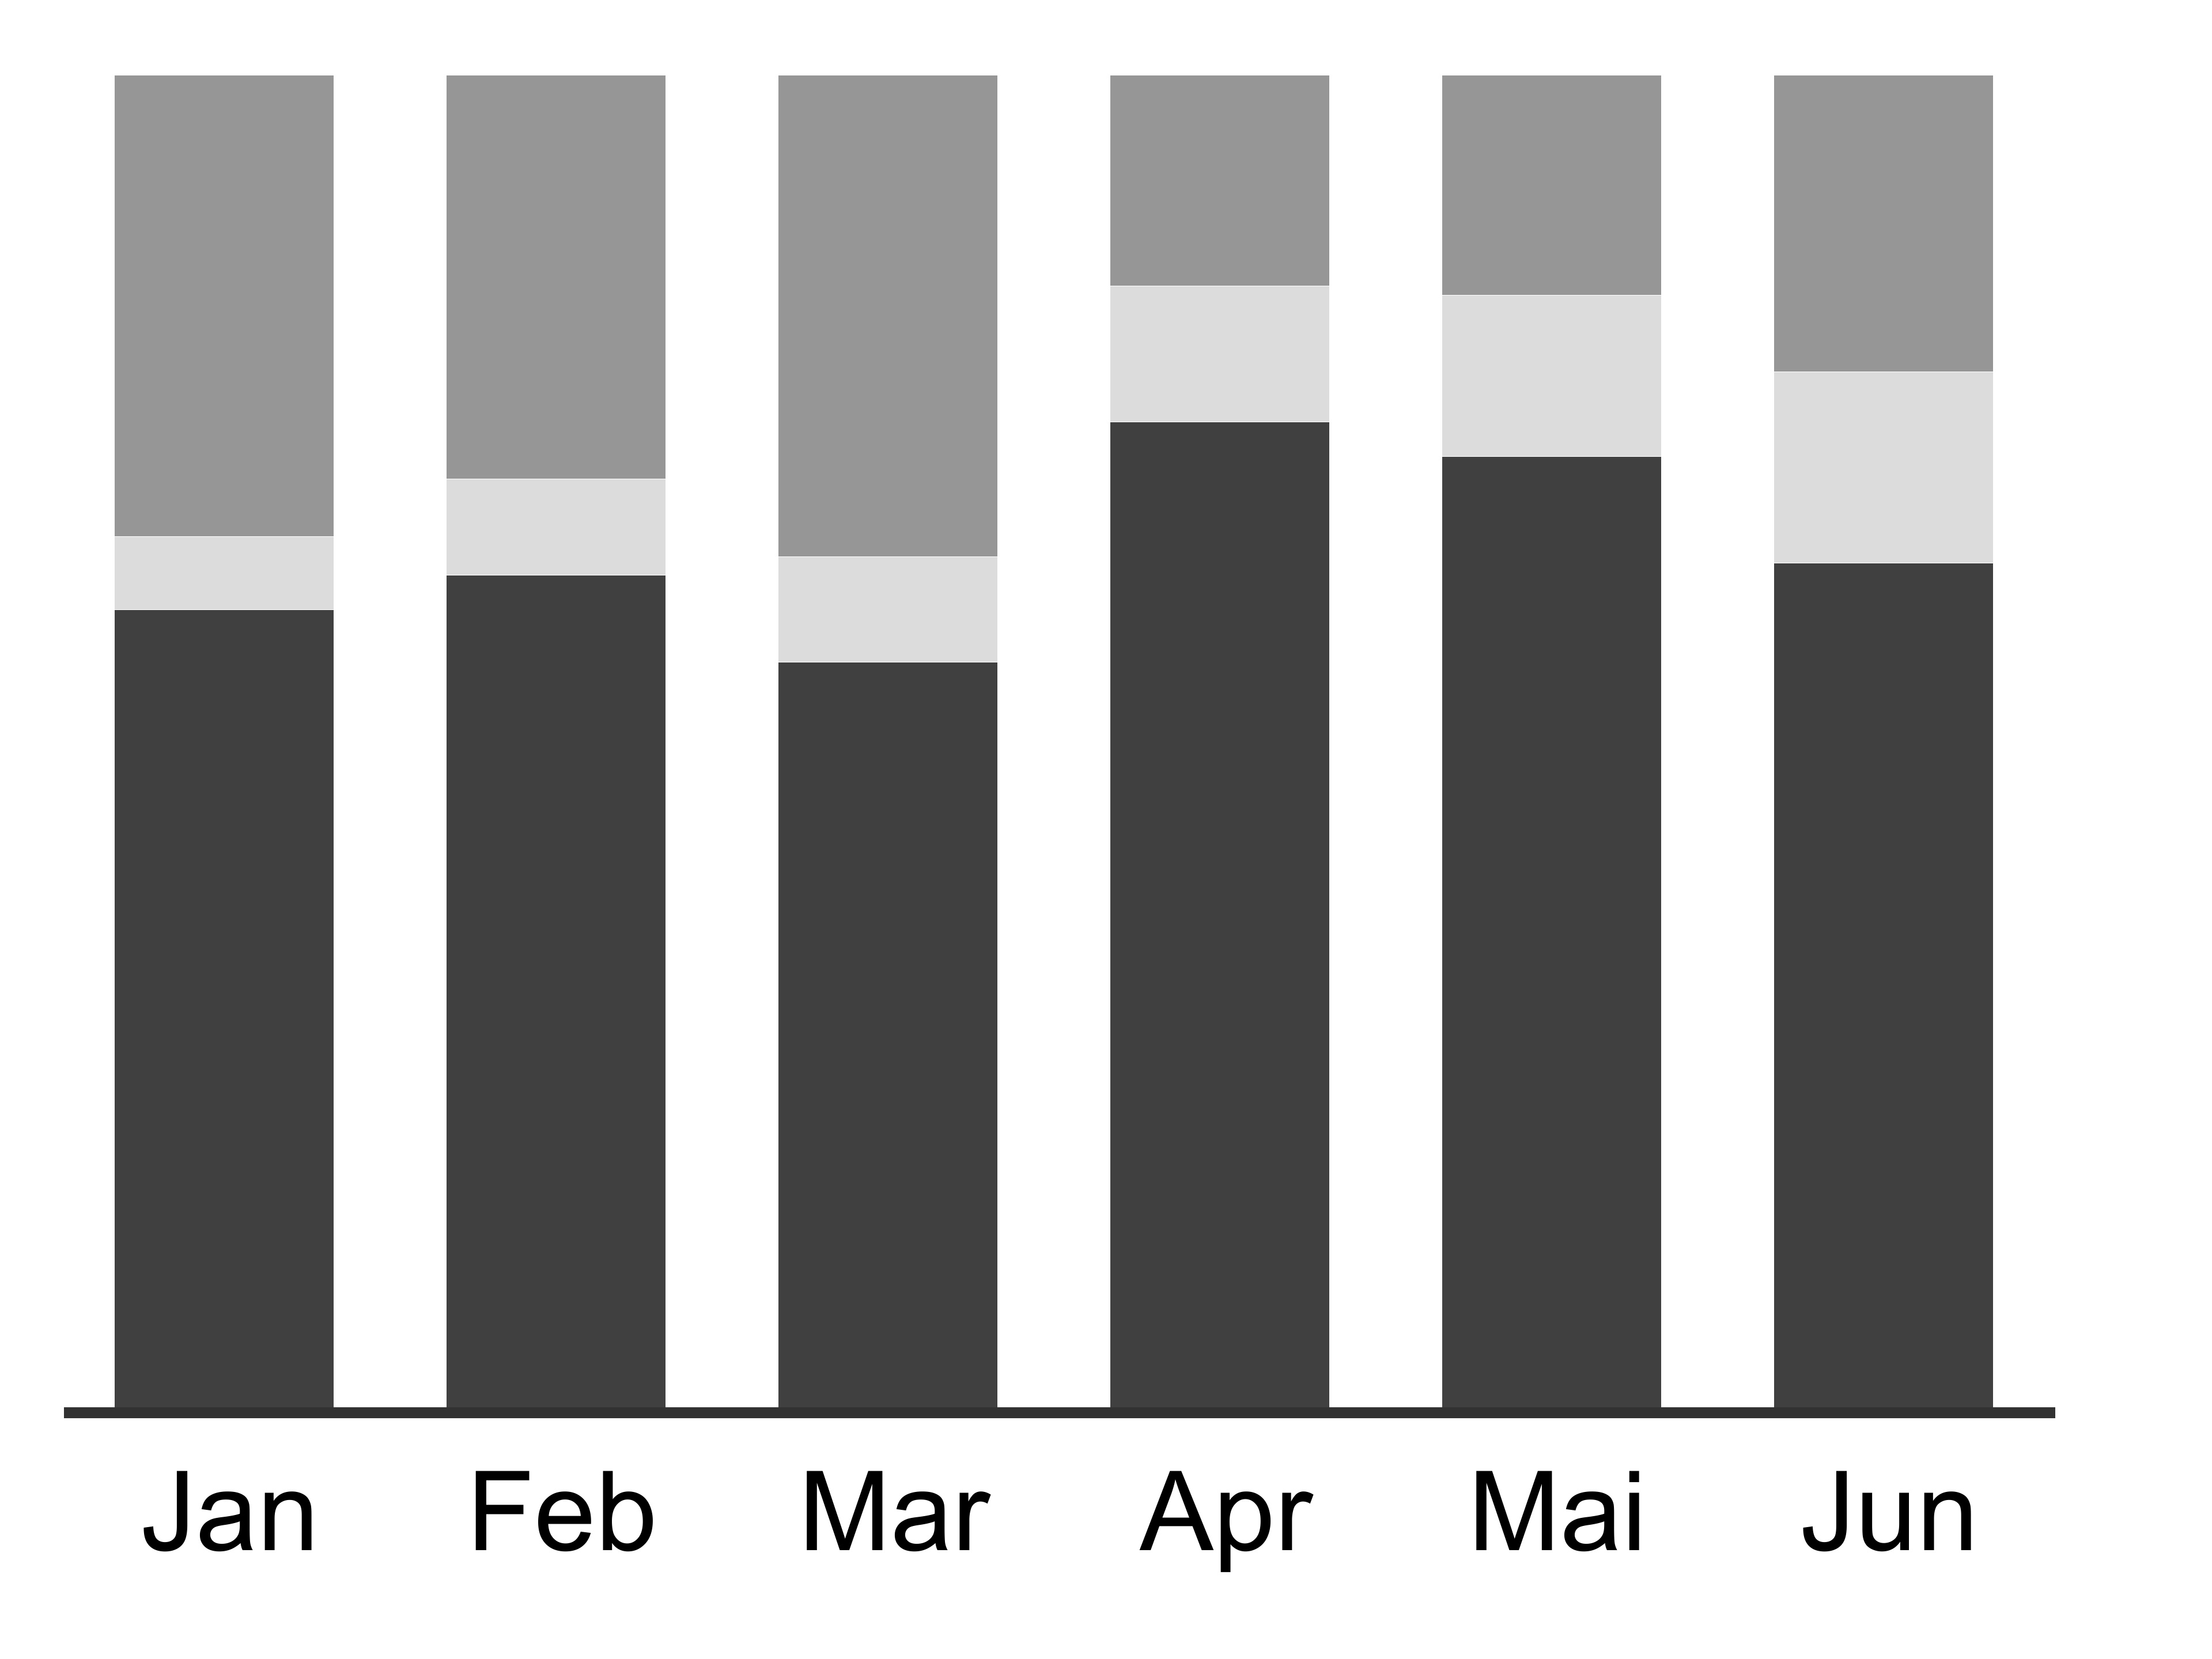
| STACKED100_TIME | The CMDXF data will be shown as stacked 100% bars in a timeline. Each row will be shown as a new stacked series in one axis for the whole visualization. |
Subcharts: Data rows Categroies: Data columns Variances: Data rows |
 |
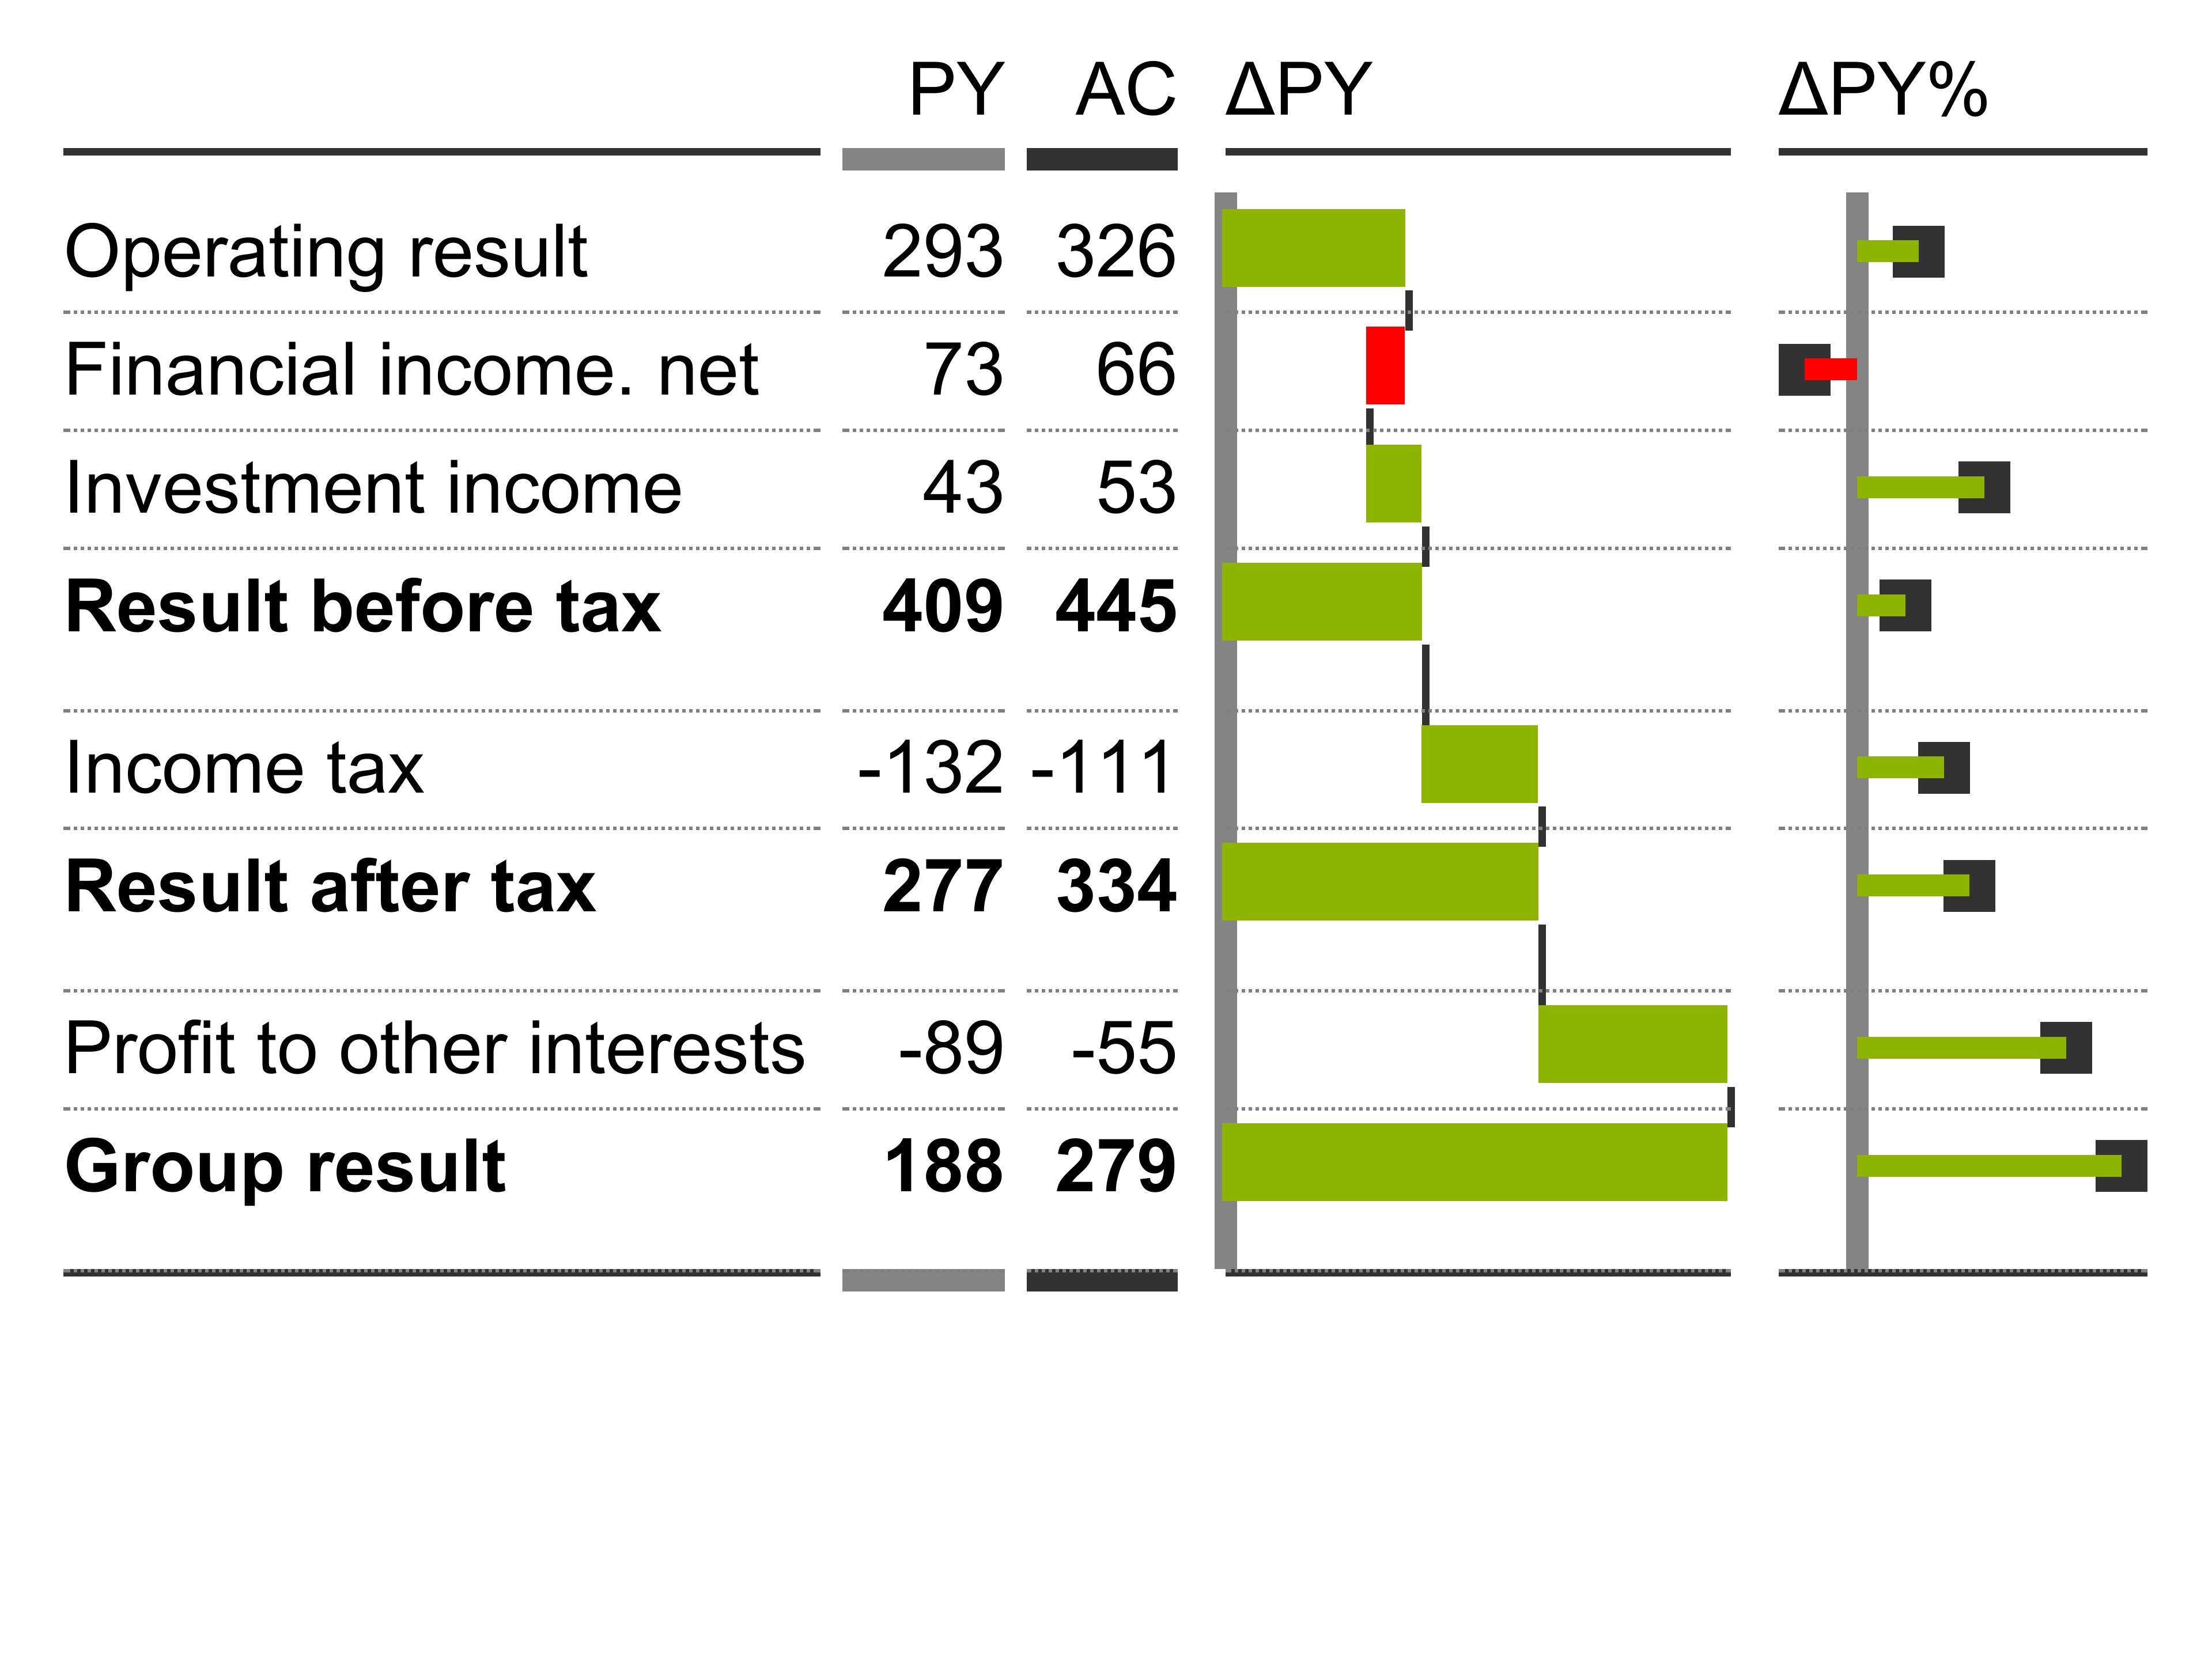
| TABLE_STRUCTURE | Visualize the CMDXF data as a table in structure form. If the CMDXF data includes a hierarchy in the row dimensions, the table will be shown in a hierarchical view. Each column will become a new table column. |
Subcharts: Data columns Categroies: Data rows Variances: Data columns |
 |
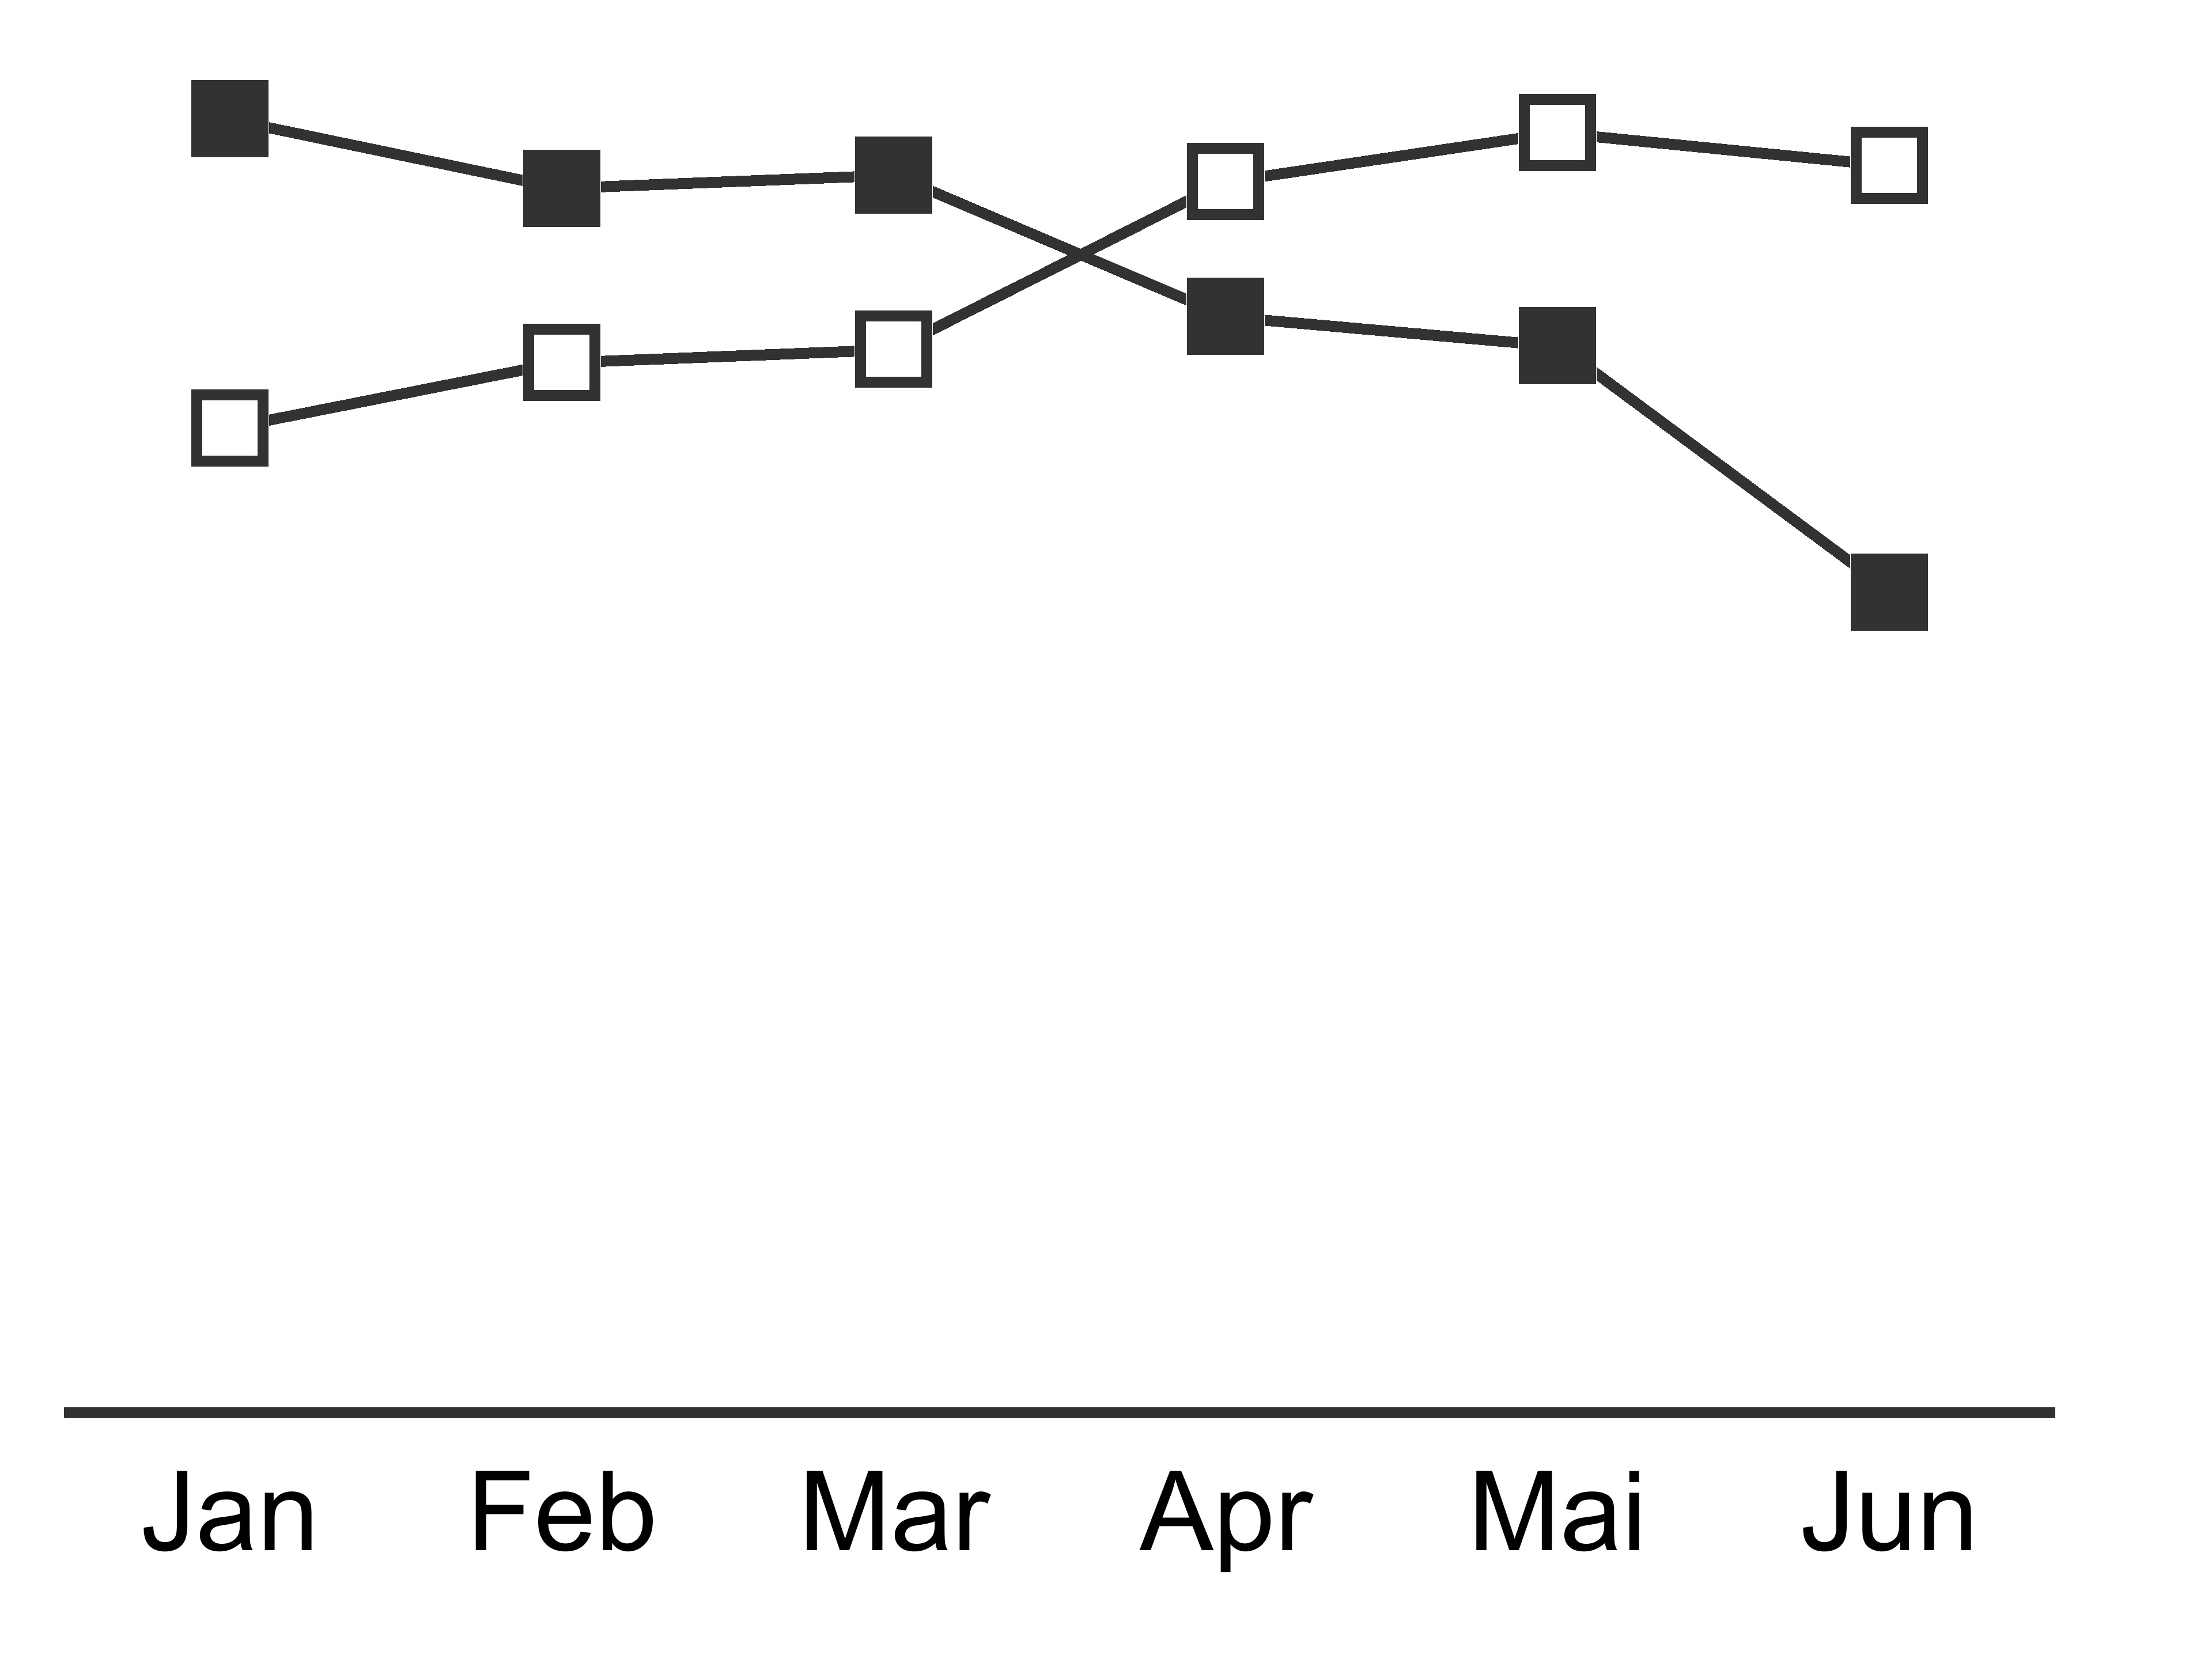
| POINTLINE_STRUCTURE | The CMDXF data will be shown as point-line charts in a timeline. Each row will be shown as a new series in one axis for the whole visualization. |
Subcharts: Data rows Categroies: Data columns Variances: Data rows |
 |
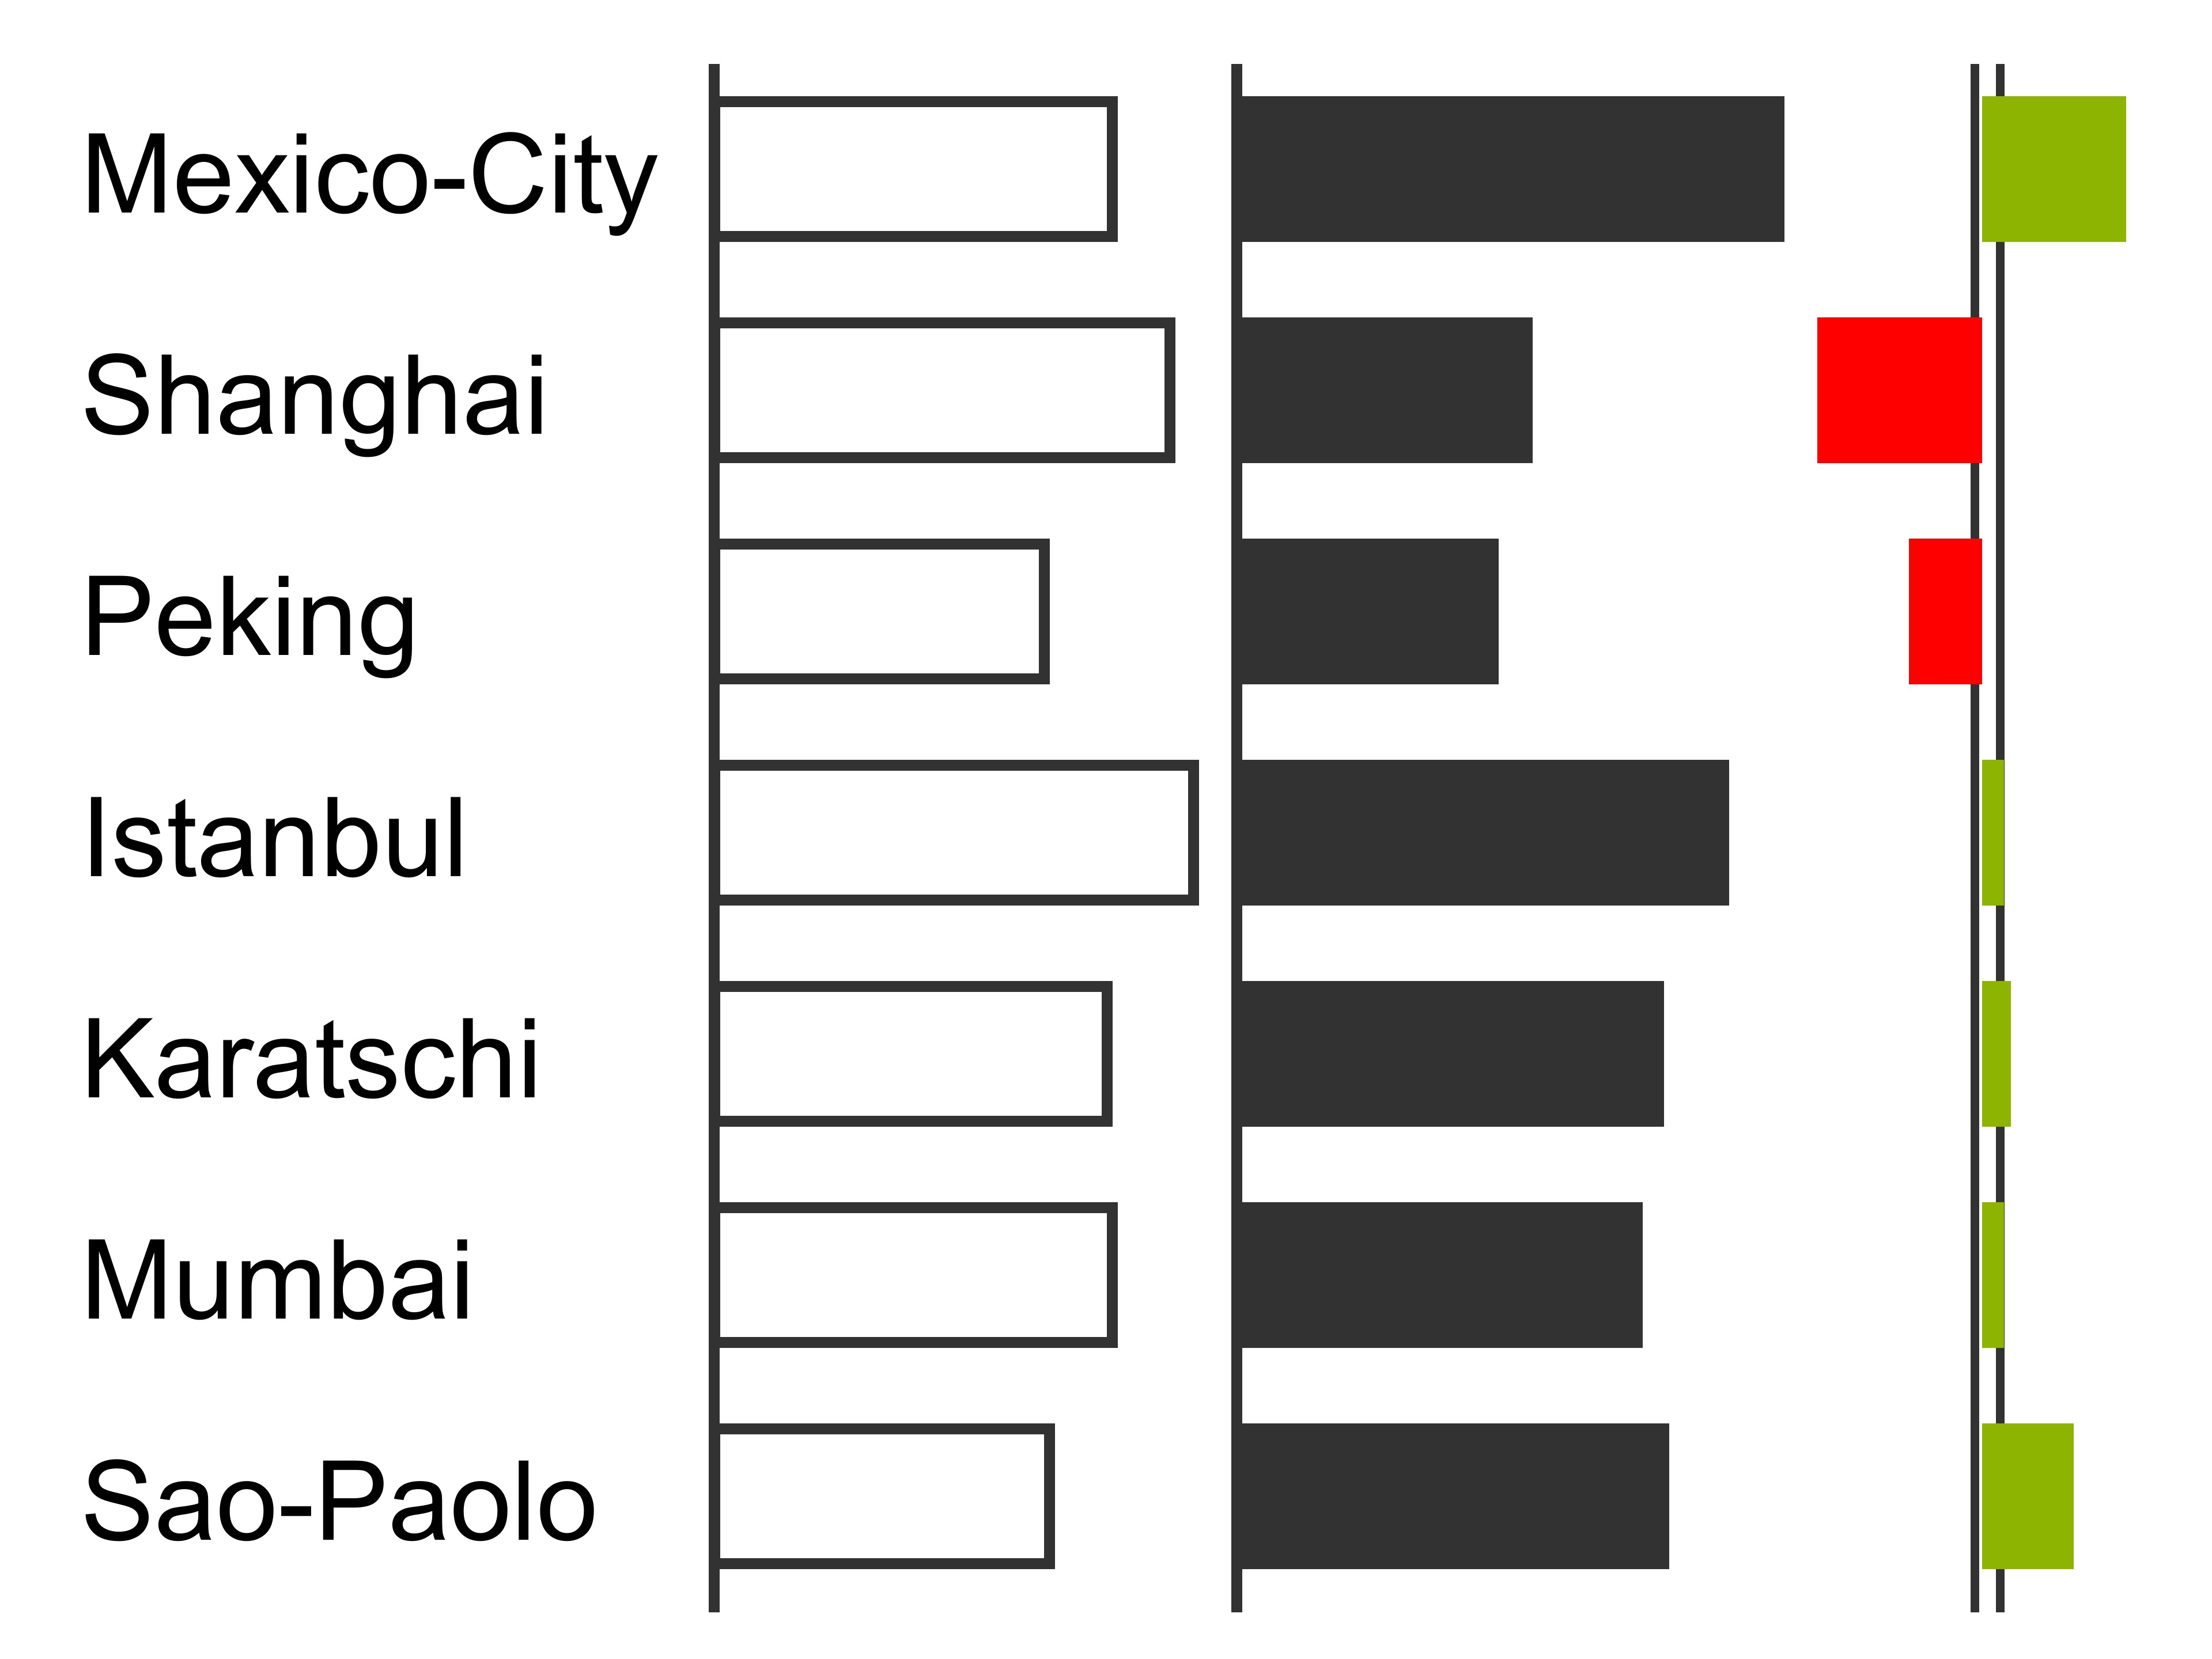
| SINGLE_STRUCTURE | The CMDXF data will be shown as bars in a structure. Each column will have its own axis. |
Subcharts: Data columns Categroies: Data rows Variances: Data columns |
 |
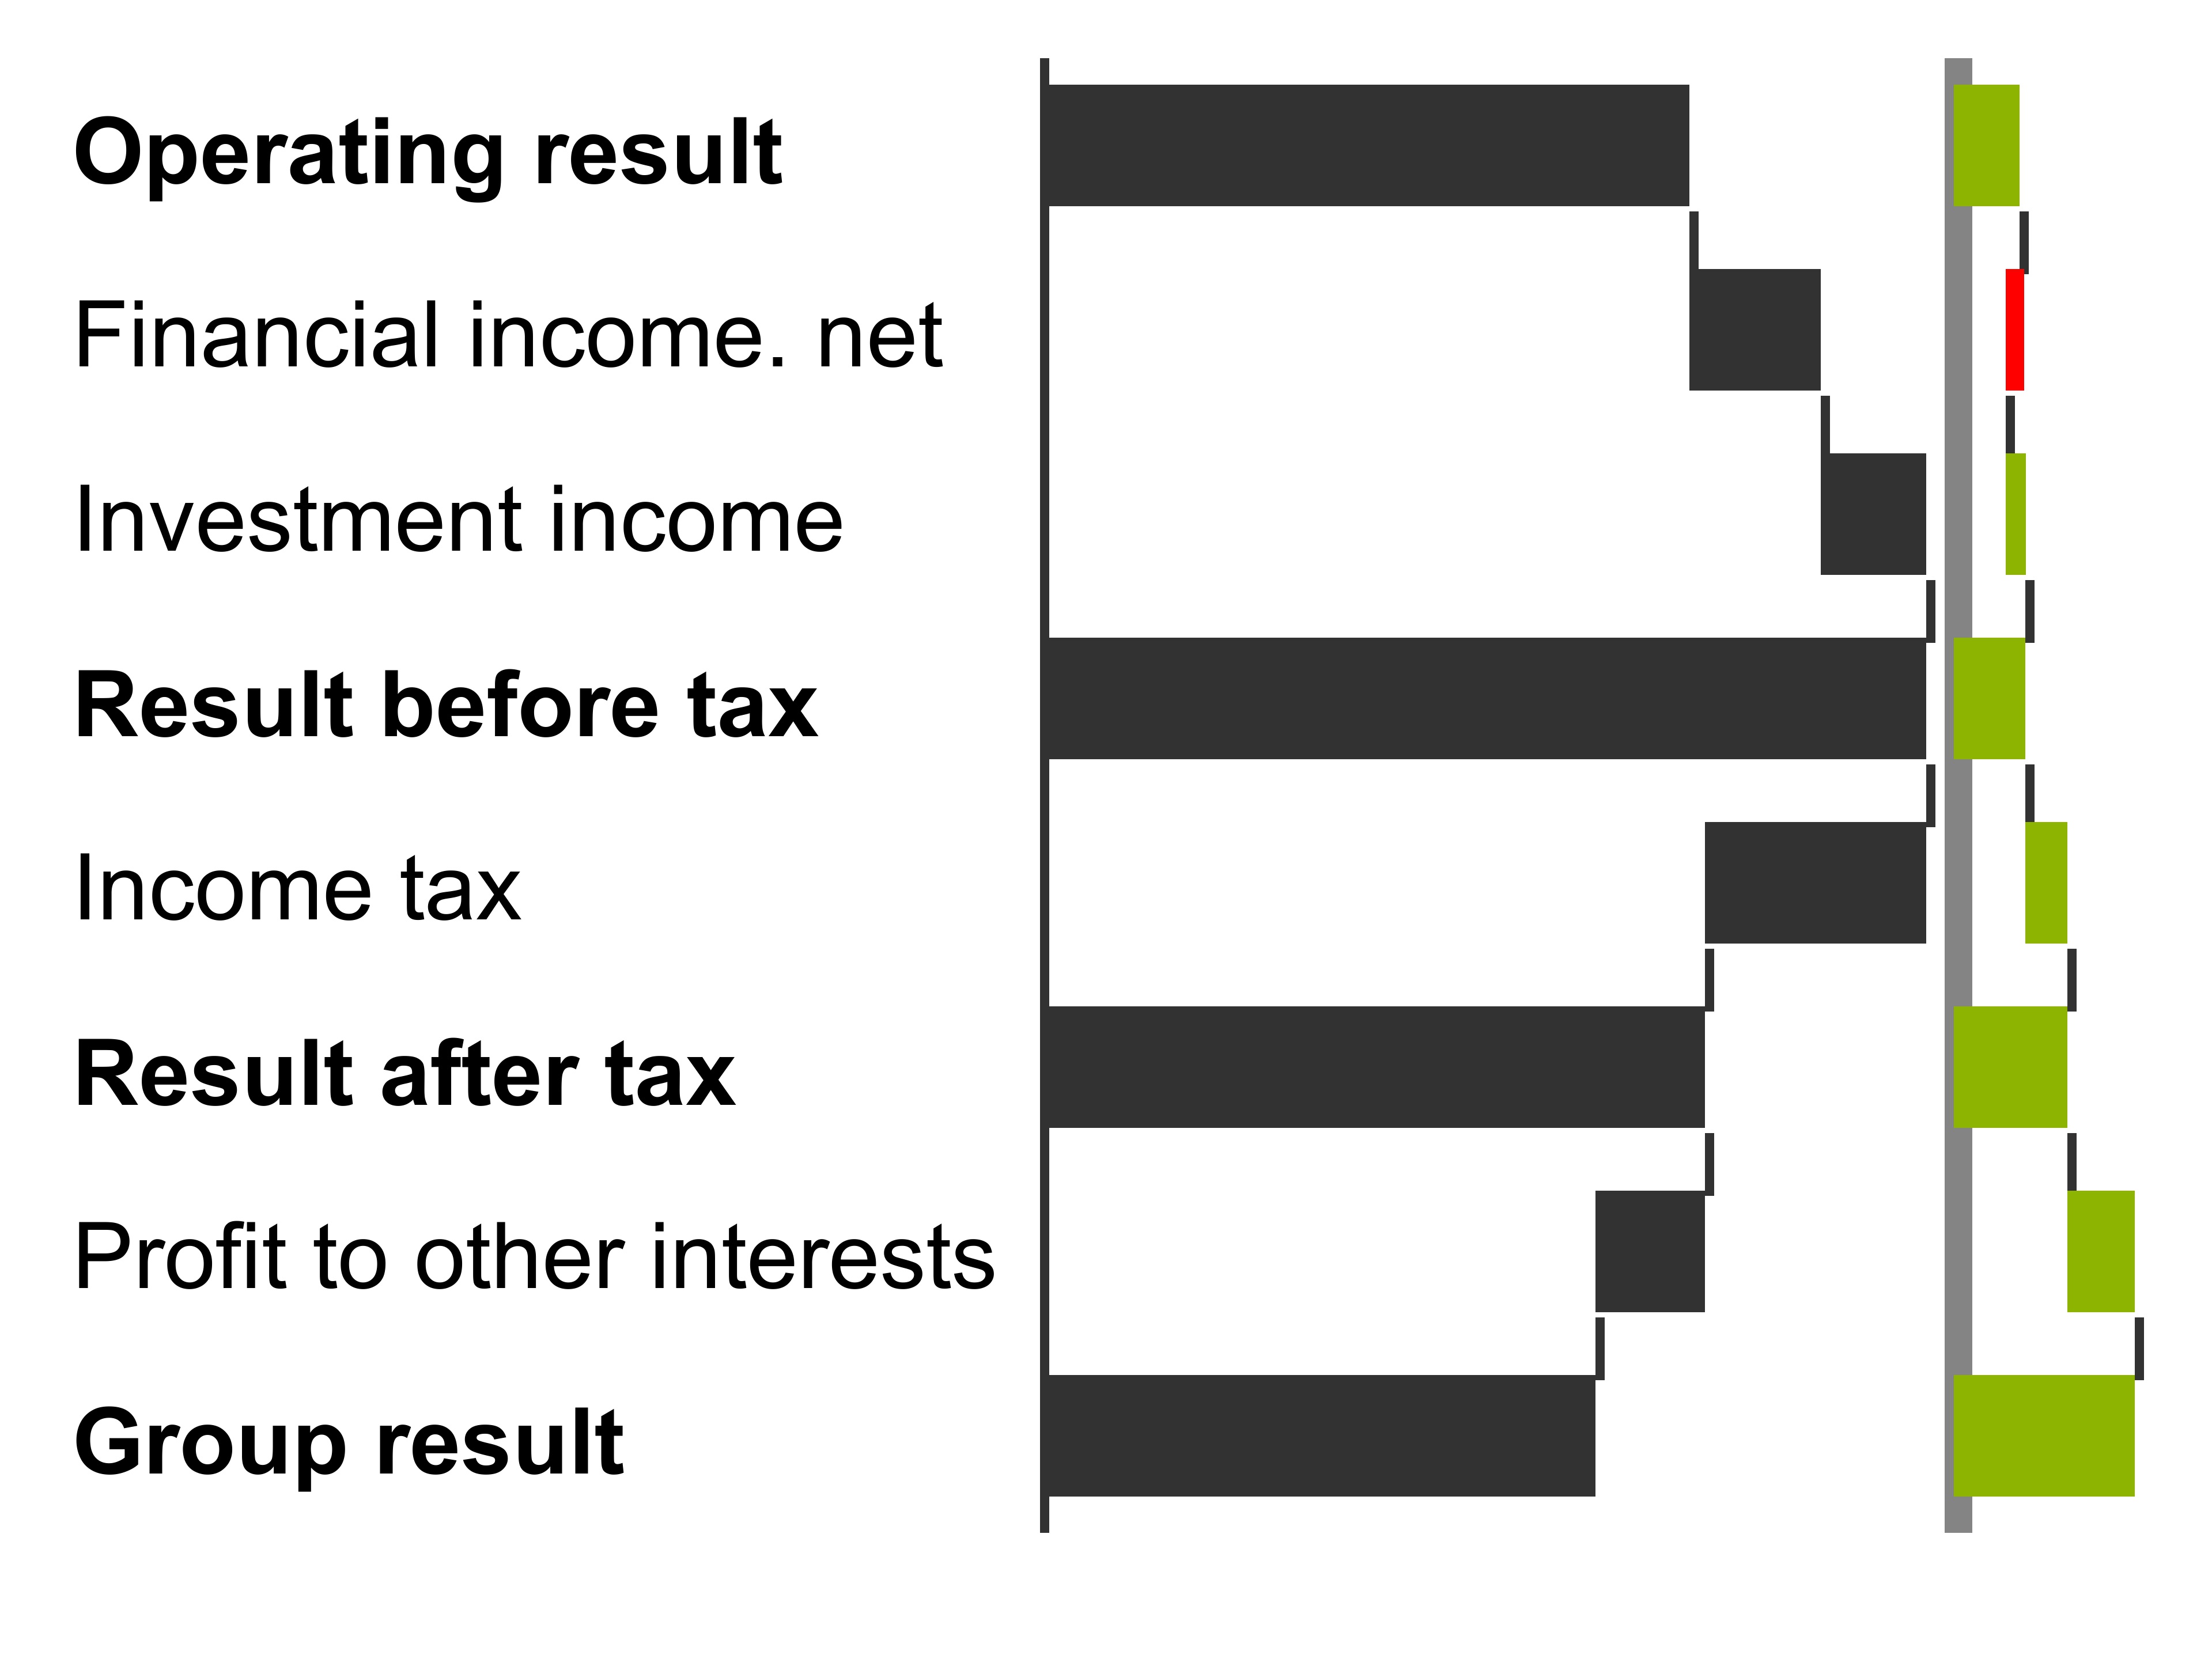
| WATERFALL_STRUCTURE | The CMDXF data will be shown as waterfall bars in a structure. Each column will have its own axis. The waterfall depends on the hierarchy informations of the column dimensions. |
Subcharts: Data columns Categroies: Data rows Variances: Data columns |
 |
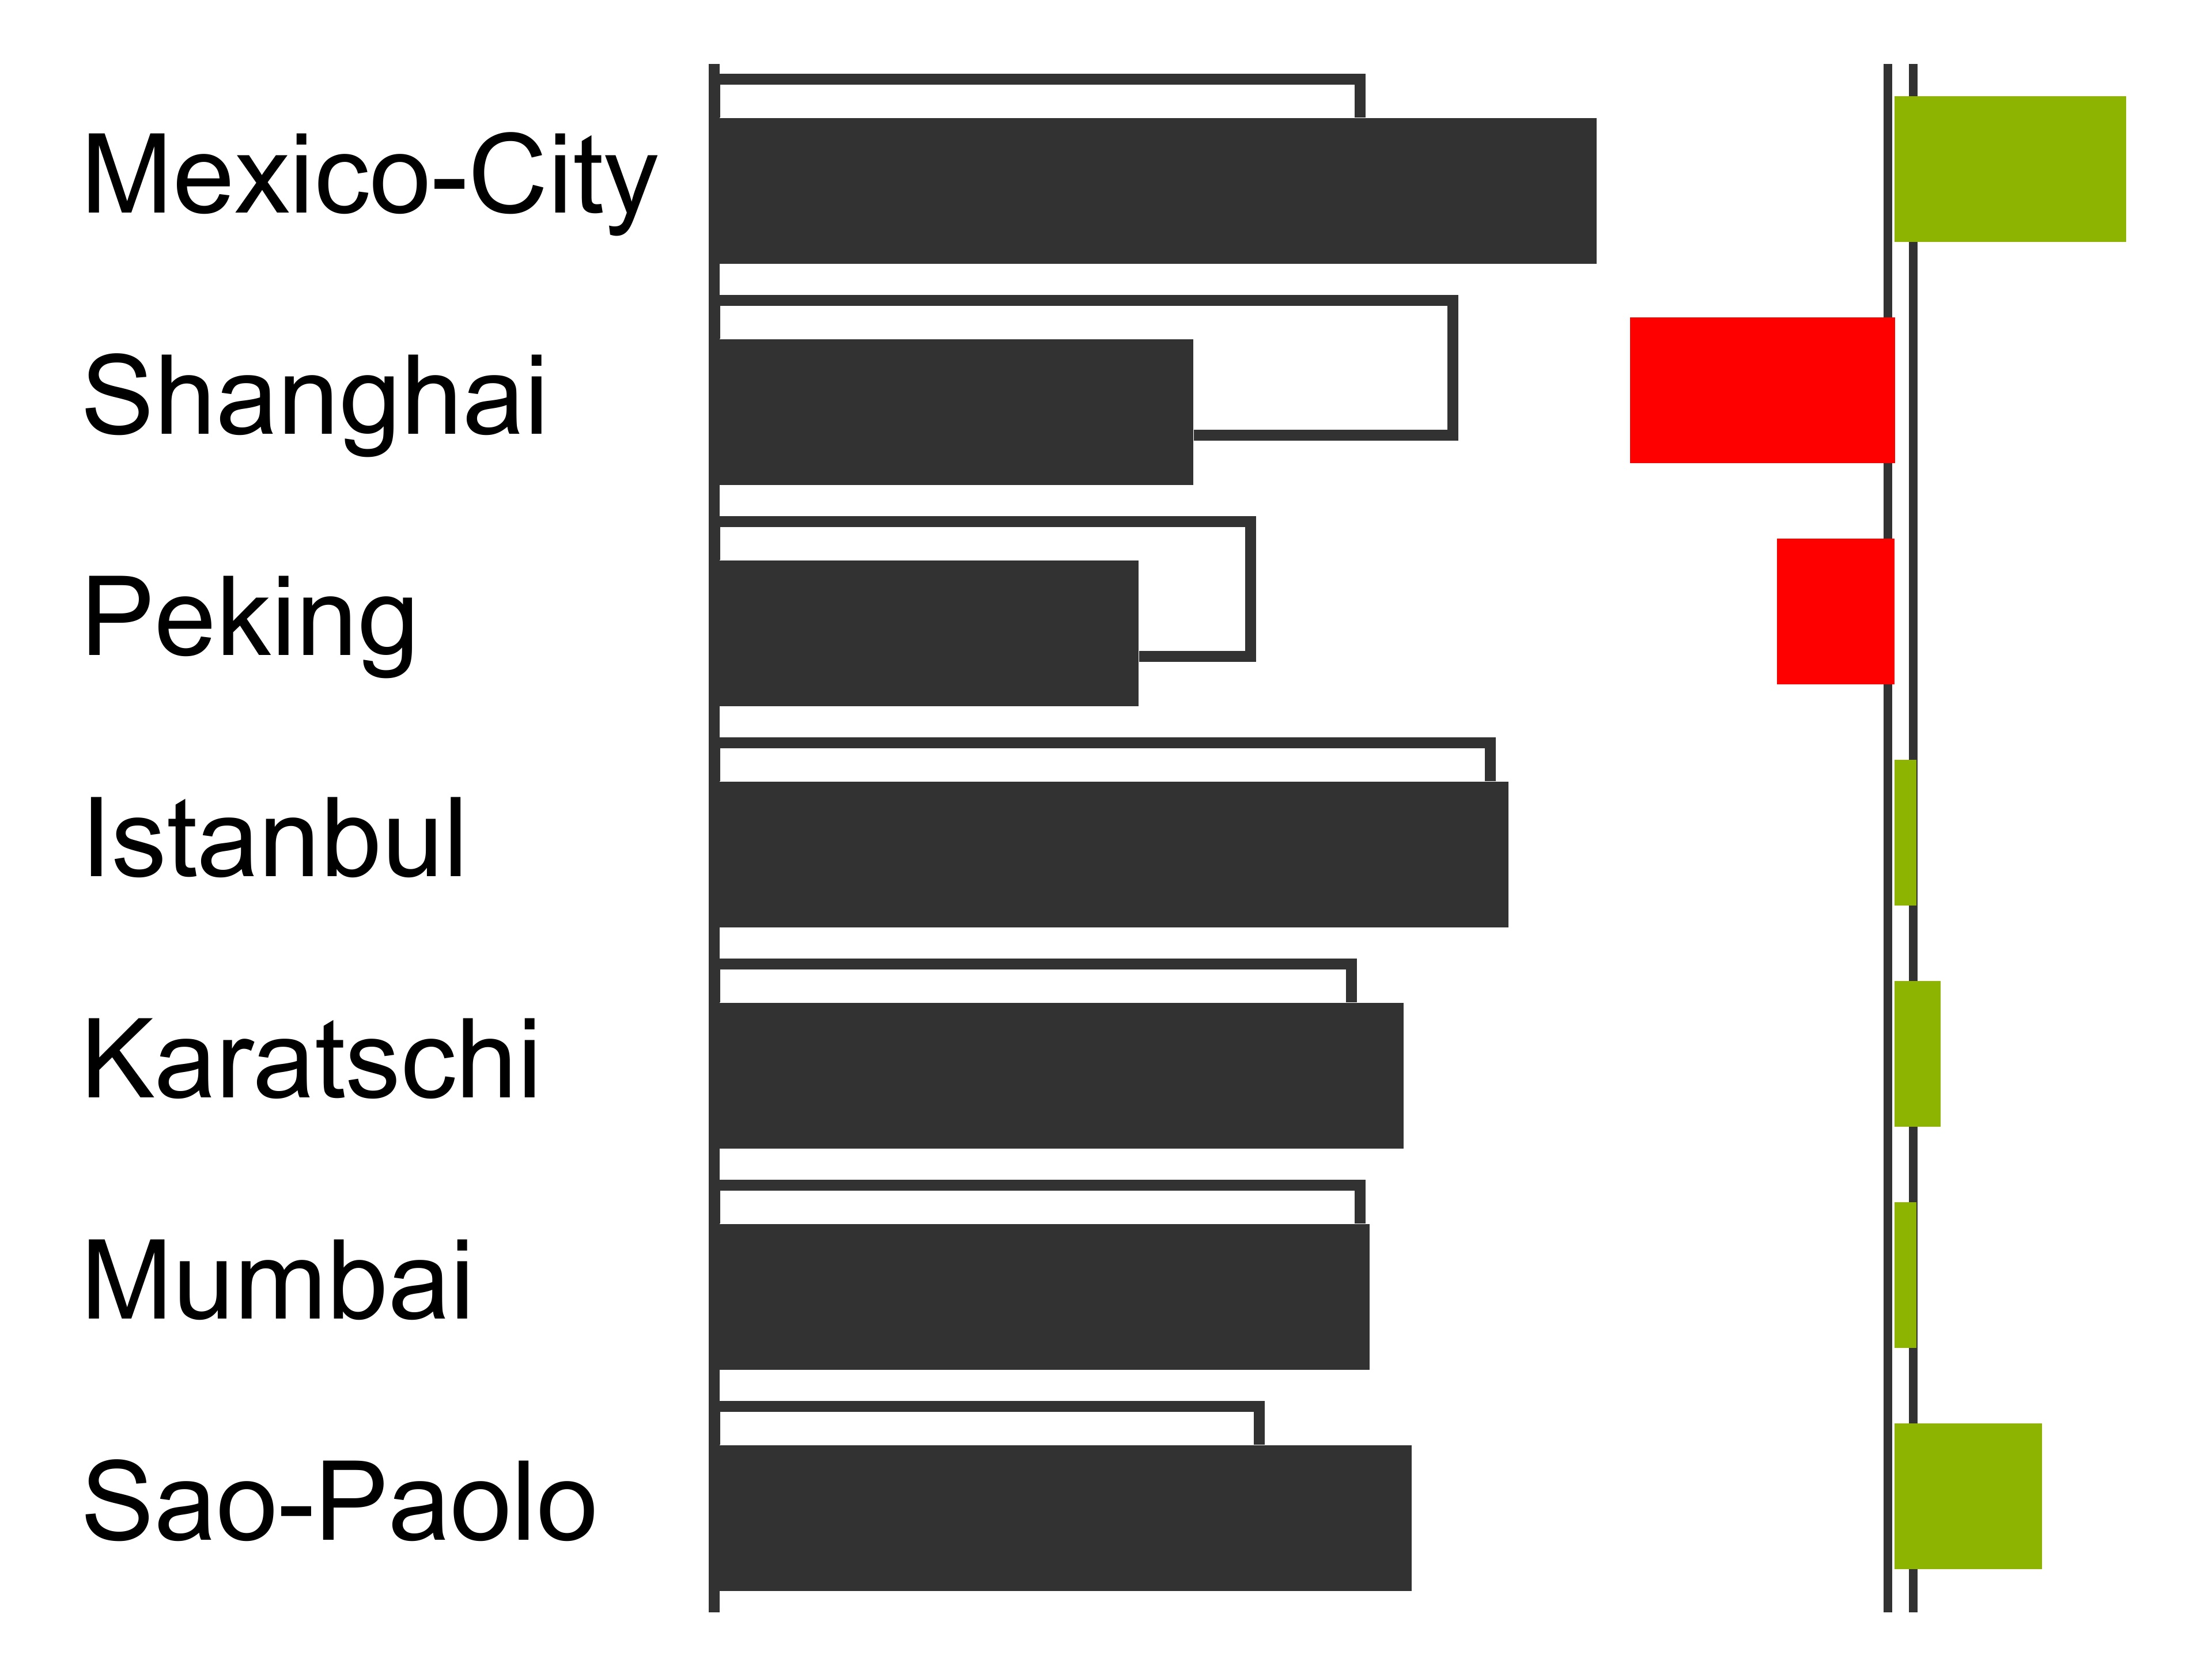
| GROUPED_STRUCTURE | The CMDXF data will be shown as grouped bars in a structure. Each column will be shown as a new series in one axis for the whole visualization. |
Subcharts: Data columns Categroies: Data rows Variances: Data columns |
 |
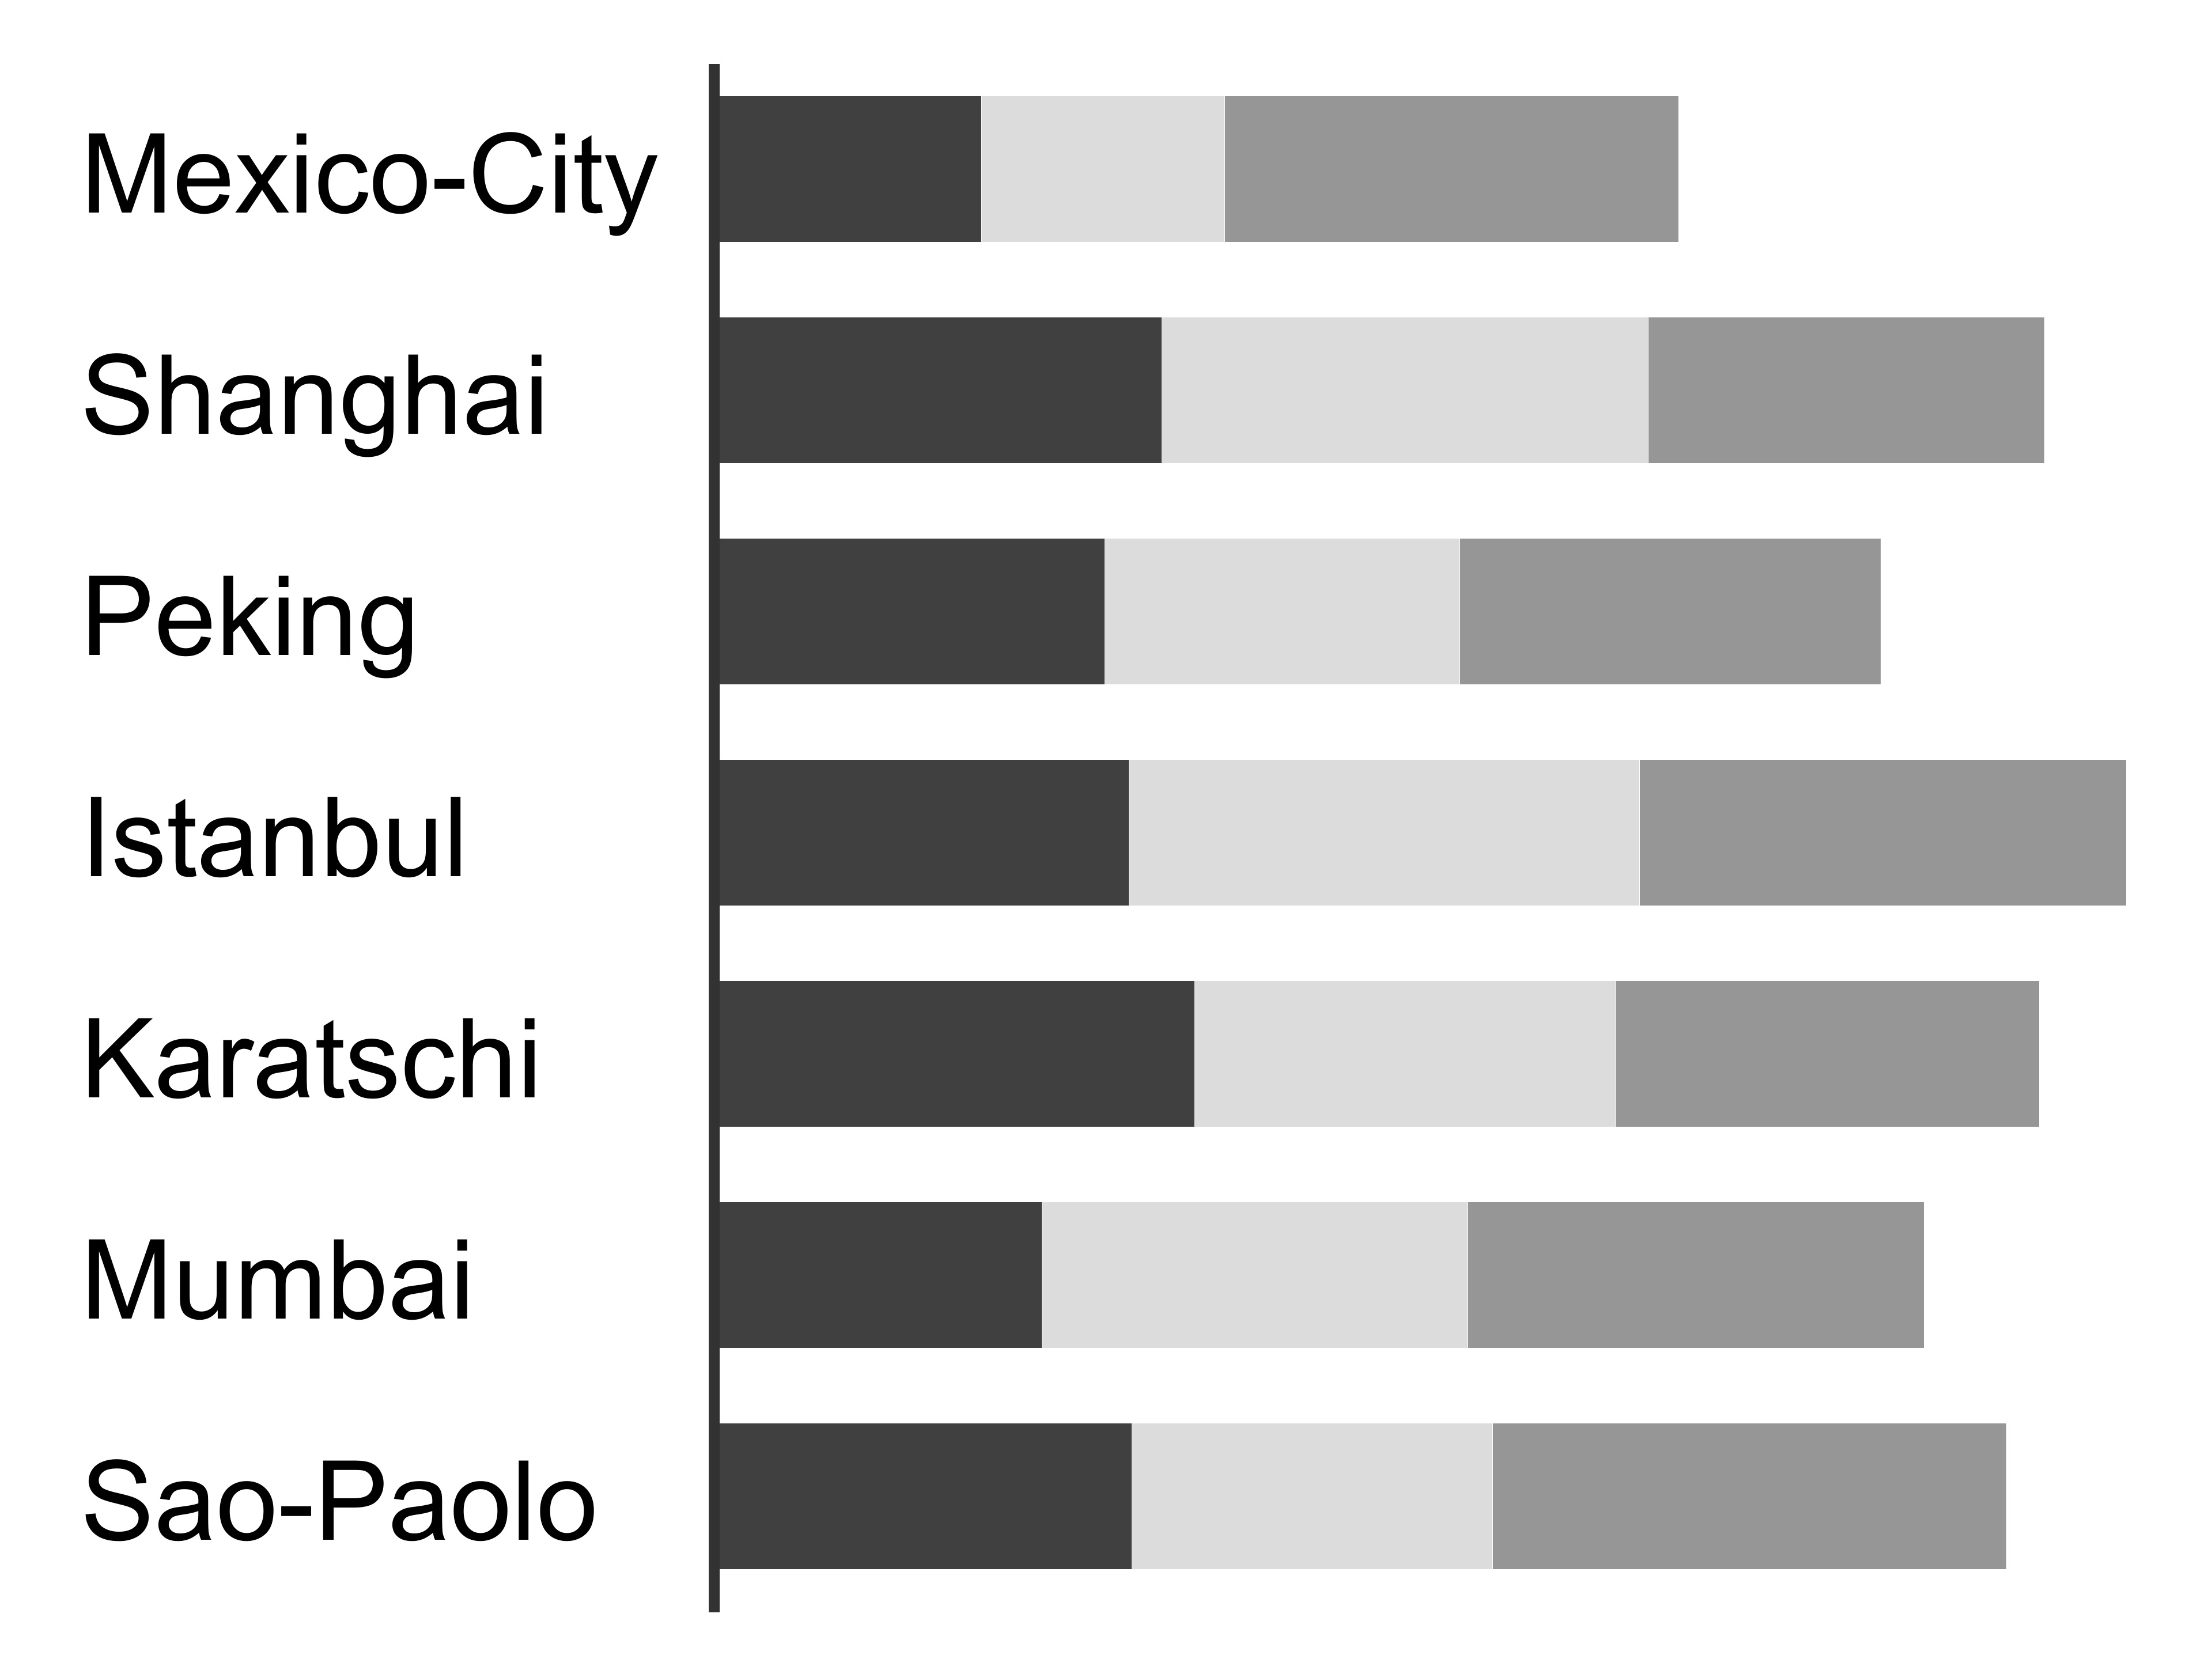
| STACKED_STRUCTURE | The CMDXF data will be shown as stacked bars in a structure. Each column will be shown as a new stacked series in one axis for the whole visualization. |
Subcharts: Data columns Categroies: Data rows Variances: Data columns |
 |
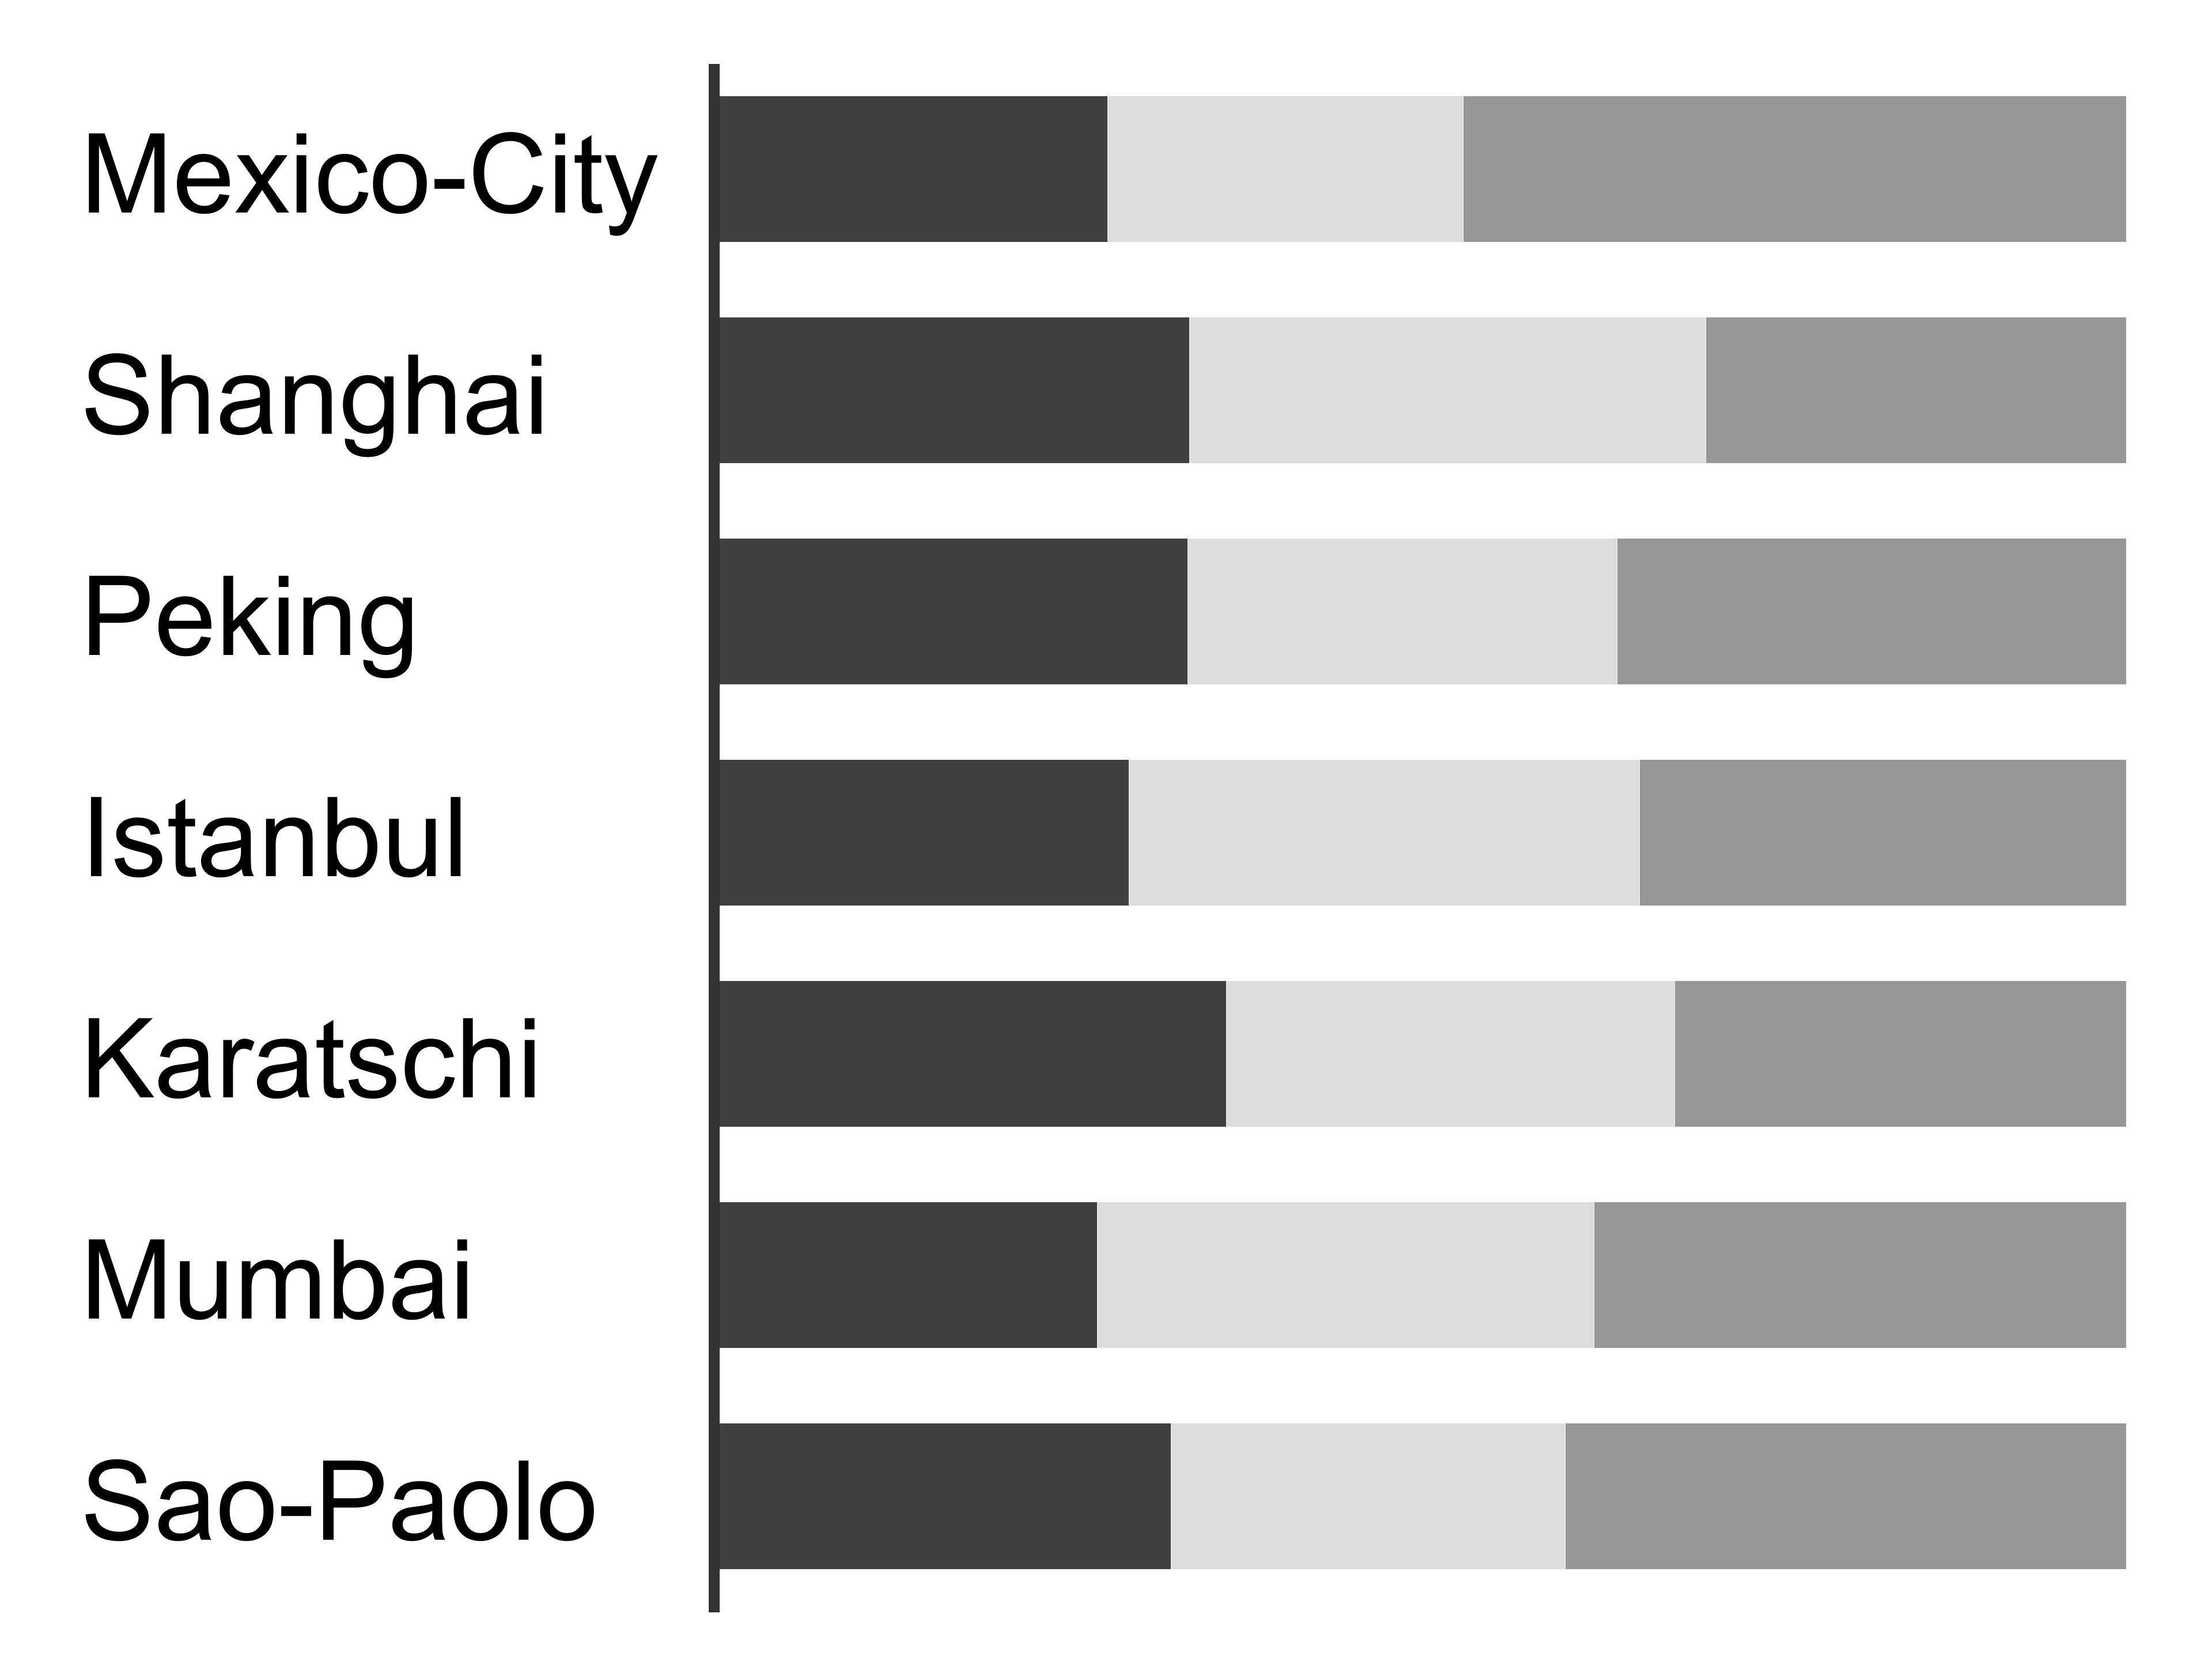
| STACKED100_STRUCTURE | The CMDXF data will be shown as stacked 100% bars in a structure. Each column will be shown as a new stacked series in one axis for the whole visualization. |
Subcharts: Data columns Categroies: Data rows Variances: Data columns |
 |
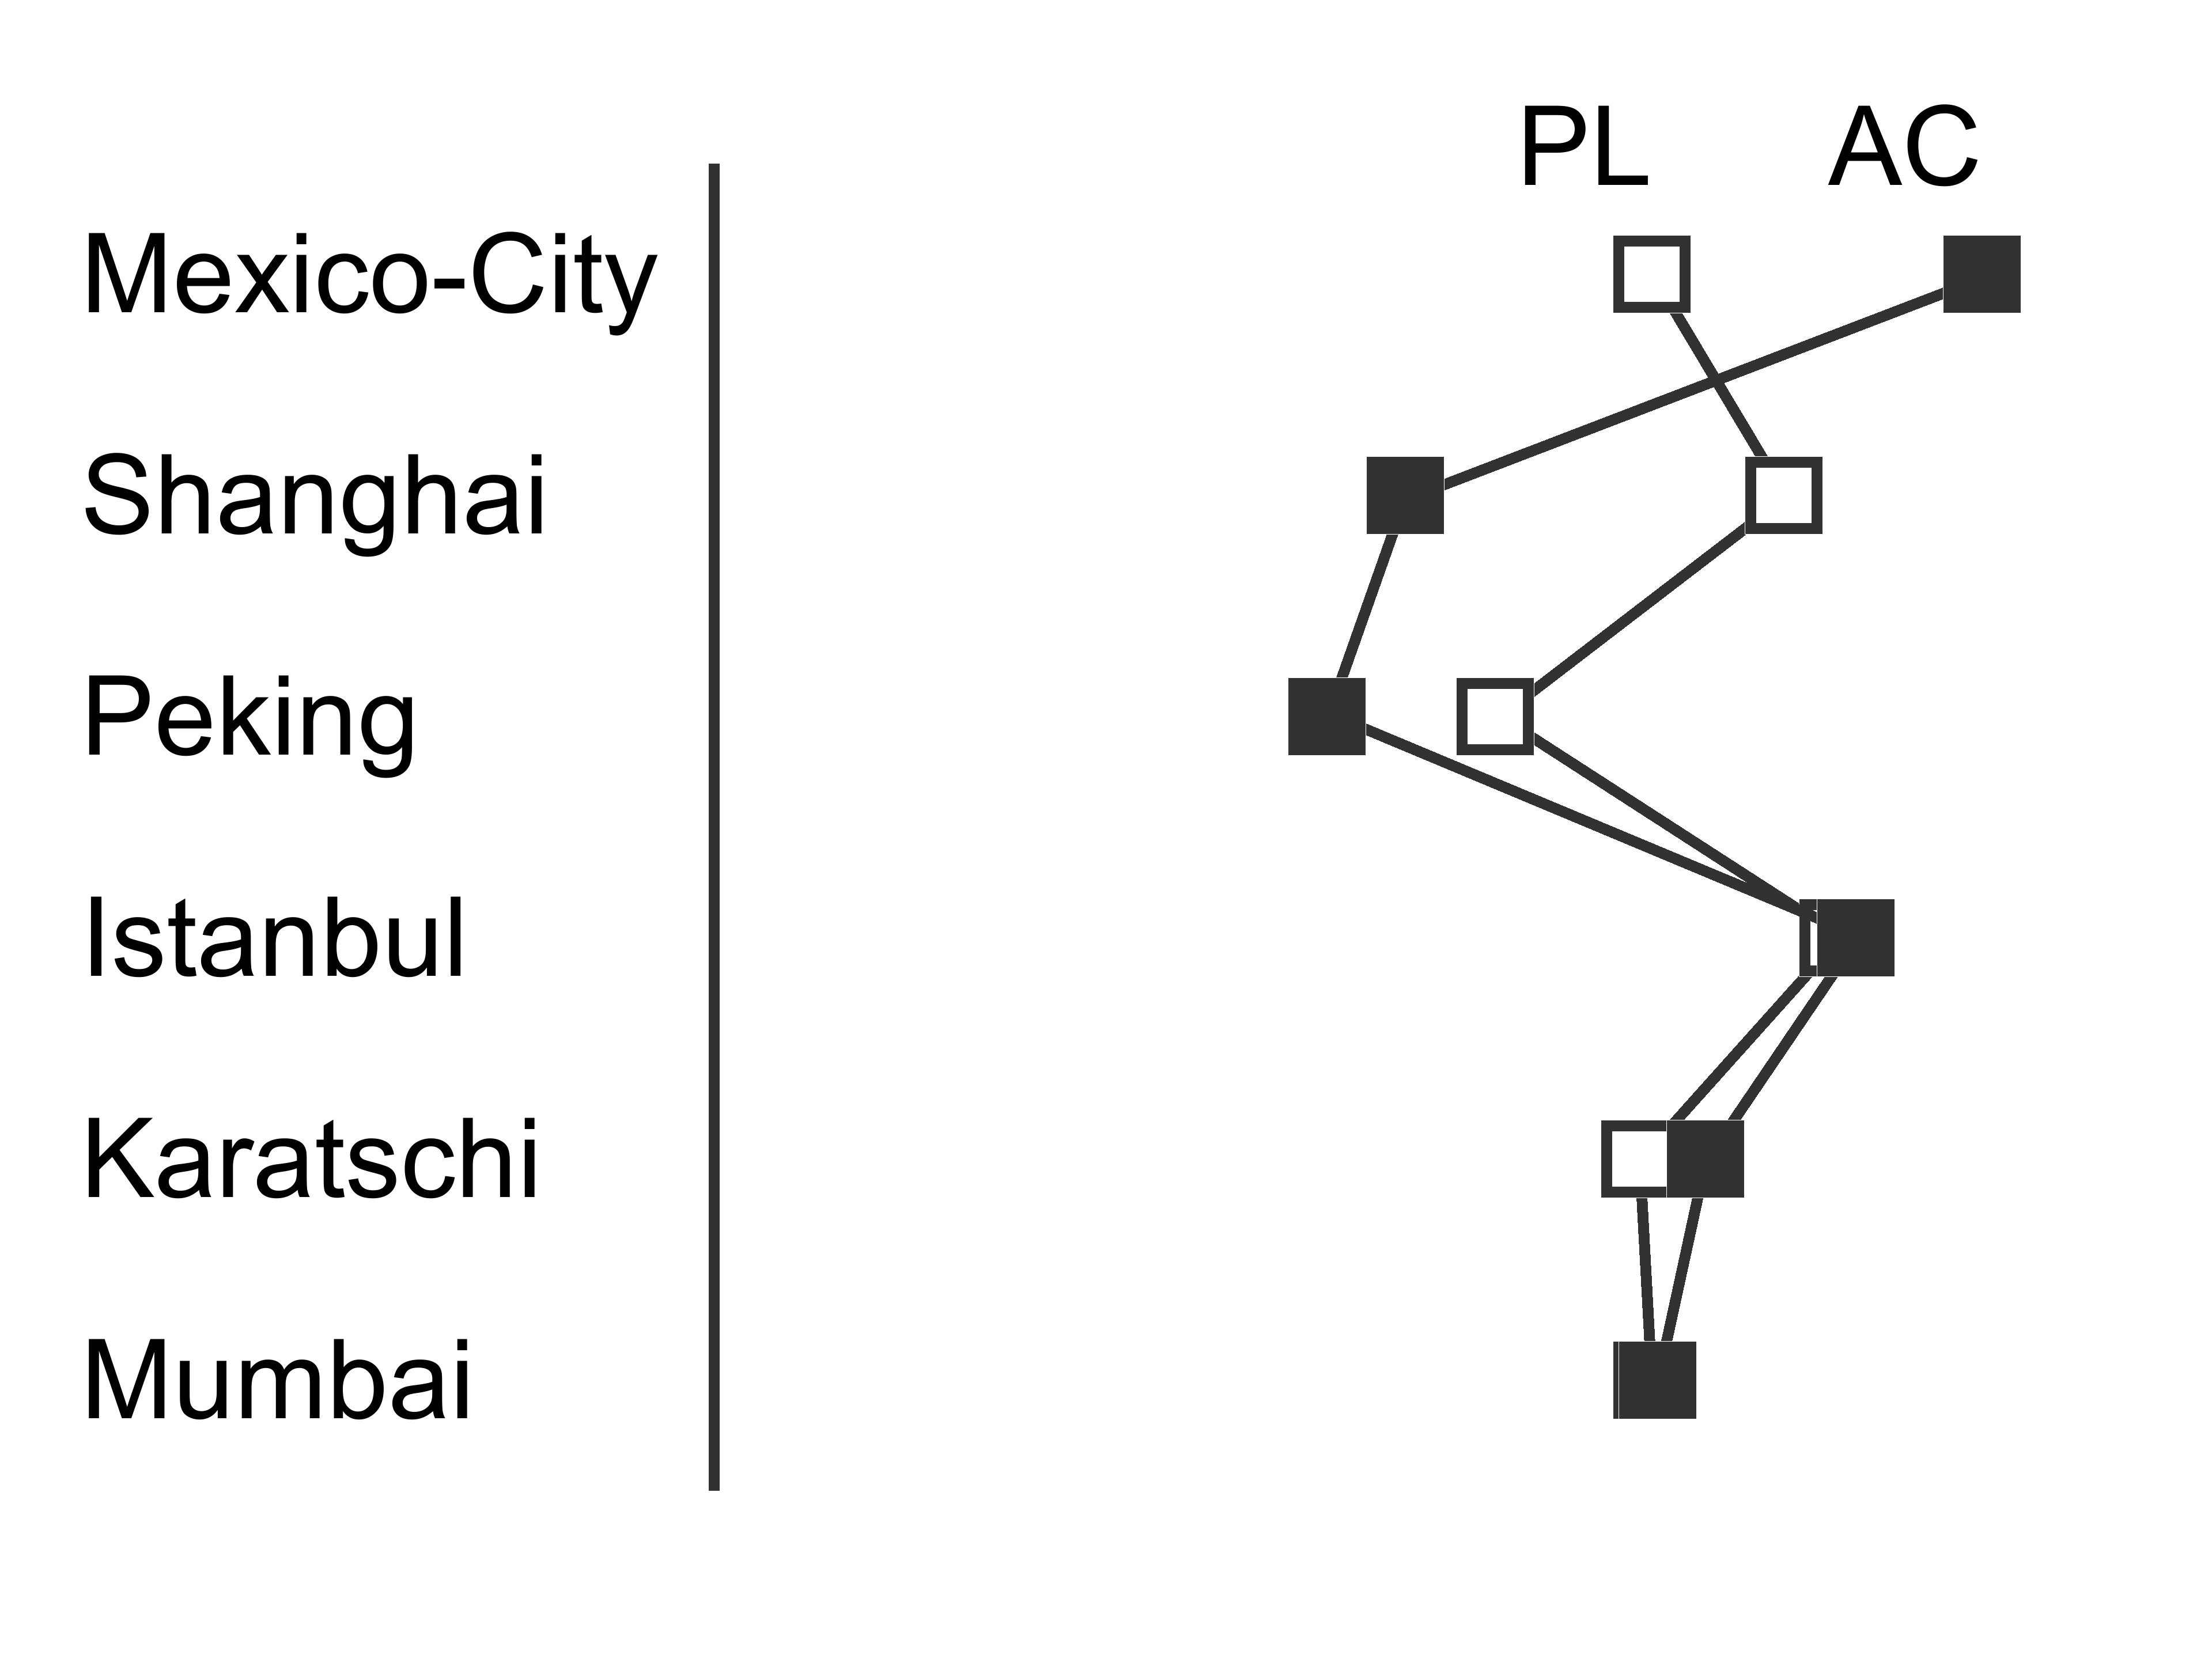
| POINTLINE_STRUCTURE | The CMDXF data will be shown as point-line charts in a structure. Each column will be shown as a new series in one axis for the whole visualization. |
Subcharts: Data columns Categroies: Data rows Variances: Data columns |
 |
Variances and Scenarios (optional)
It is possible to define a member in the CMDXF data as a variance and/or a scenario. Therefore you have the possibility to set the information on a member inside a dimension. When you define the attributes, Chart-me visualize the associated series as defined in the default. You have the following setting possibilities:
| isVariance | Definition |
|---|---|
| NONE | No variance |
| ABSOLUTE | Absolute variance |
| RELATIVE | Relative variance |
| isScenario | Definition |
|---|---|
| NONE | No scenario |
| PY | Previous year |
| AC | Actual |
| PL | Plan |
| FC | Forecast |
Also you can define isScenarioVar in the same way as the isScenario for variances. Chart-me will set the scenarios in the right way.
Sample data
You can download the following example files to see some example data
REST API
For a first connection to Chart-me Studio it is possible to use a REST API to provide your data in the cmdxf format described in this tutorial. In Chart-me Studio it is possible to define a CMDXF Connection to this REST-API. PLease contact the IT-department of the Chart-me Studio. There are two GET functions, which provides the whole REST functionality at this point:
- getViews - GET Paremeters:
- type: getViews
- folder: 'your folder name'
- getViewData
- type: getViewData
- folder: 'your folder name'
- view: 'name.json'
getViews
GET Paremeters:
- type: getViews
- folder: 'your folder name'
Example: https://chart-me-cloud.com/chart-me/V2.7.4/chartme_server/cmdxf/index.php?type=getViews&folder=demos
Returns:
views: [
	"quarters.json",
	"timeseries.json"
]
getViewData
GET Paremeters:
- type: getViewData
- folder: 'your folder name'
- view: 'name.json'
Returns:
view: {
	"id": "xxx",
	"name": "Quarters",
	...
}